Tag: snn financial

  • Money Dysmorphia: What It Is, Who Has It, and How to Fix It

    Money Dysmorphia: What It Is, Who Has It, and How to Fix It

    If you’ve spent time convincing yourself you’re behind financially, that you’ll never feel ready to retire, or that everyone else has figured out something you haven’t, you’re not alone. That experience has a name: money dysmorphia.

    The term borrows from body dysmorphia, a condition where people perceive flaws in their appearance that aren’t visible to others. The financial version works the same way: a mismatch between what’s real and what feels real about your finances.

    Money dysmorphia isn’t a formal clinical diagnosis in the DSM. But it describes a pattern that shows up across every income level, age group, and balance sheet size — and it’s worth understanding, because it can drive financial decisions that cost you.

    What Is Money Dysmorphia?

    Money dysmorphia is a distorted perception of your financial situation. You might feel broke when you’re stable, or feel insecure even when you’re objectively secure. It can show up as constant anxiety about money, chronic feelings of being behind, or avoiding financial decisions because they feel overwhelming, regardless of what your balance sheet says.

    The core issue is the distance between what’s true and what feels true about your finances.

    Money Dysmorphia Shapes Real Financial Behavior

    The distortion shows up in what you do: avoiding your accounts, checking them multiple times a day, making financial decisions from fear or shame rather than facts.

    Over time, those patterns carry real consequences. Over-saving and under-spending. Taking on unnecessary risk. Staying stuck in stress even when the numbers say you’re okay.

    Because money dysmorphia is a behavioral term, not a clinical diagnosis, there’s no single checklist for it. But recognizing that your financial feelings may not match your actual situation is where change starts.

    Almost Half of Americans Feel Behind Financially, Even When They’re Stable

    Money dysmorphia is common across age groups, but it hits younger adults hardest. A 2024 Credit Karma survey put the overall prevalence at 29% of Americans, with rates nearly double that among Gen Z and millennials.

    Group Experience Money Dysmorphia
    All Americans 29%
    Gen Z 43%
    Millennials 41%
    Gen X 25%
    Age 59+ 14%

    Source: Intuit Credit Karma, 2024

    The same survey found a striking difference in how people with and without money dysmorphia experience their own finances.

    Feel Behind Financially
    Experience money dysmorphia 82%
    Do not experience money dysmorphia 29%

    Source: Intuit Credit Karma, 2024

    The distress is often less about the actual numbers and more about comparison. People measure themselves against others, or against their own expectations of where they should be, and that space between perception and reality is where the anxiety lives.

    Do You Have Money Dysmorphia? Here’s How to Tell

    You don’t need a diagnosis to notice these patterns in yourself. Ask:

    • Do you often feel behind financially even though you pay your bills and have some savings?
    • Do you avoid checking your accounts or opening financial statements because they trigger anxiety?
    • Do you compare your finances to friends, family, or people online and come up short in your own mind?
    • Have you delayed major life decisions, like retirement or a job change, because you never feel ready, even when your numbers look solid?
    • Do you feel guilty spending money on things you can afford?

    If several of these sound familiar, you may be experiencing money dysmorphia. It doesn’t matter what your income or net worth is.

    High Savers and Retirees Often Experience Money Dysmorphia in Reverse

    The term tends to get associated with younger adults who feel stuck or stretched. But for people approaching or in retirement, money dysmorphia often runs the other direction. You’ve built substantial savings, and you still feel like it’s not enough.

    That pattern is common among high savers and careful planners. You might have a seven-figure portfolio and still worry constantly about running out of money. You might delay retirement by years to be safe, even when your projections say you’re likely fine. You might spend well below what your plan can support because drawing down your savings feels like a threat.

    Research on retirees and pre-retirees shows that this kind of persistent fear can reduce quality of life even when actual shortfall risk is low. The problem isn’t the balance — it’s how you’re reading it.

    A structured retirement income plan that shows how your spending holds up across real scenarios closes that loop better than a higher account balance does. When you can see the numbers play out, the fear has less to work with — and you’re freer to spend in ways that actually improve your life.

    Social Media and Wealth Comparisons Drive the Condition

    Money dysmorphia doesn’t arise on its own. It’s fed by a mix of social, economic, and psychological forces, including the way social media compresses other people’s financial milestones into a constant highlight reel.

    The same Credit Karma study found that 27% of Americans say they’re obsessed with the idea of being rich, including 44% of Gen Z and 46% of millennials. A feed full of promotions, home purchases, and investment wins makes it feel like everyone else is racing ahead while you stand still.

    Economic uncertainty compounds it. Homeownership, debt-free degrees, early retirement: traditional markers of financial success have gotten harder to reach. Against that backdrop, the belief that you’re behind can feel like fact, even when your day-to-day situation is reasonably stable.

    The Consumer Financial Protection Bureau’s research on financial well-being cuts through those comparisons with something simpler. Their work identifies four elements of genuine financial well-being:

    • Having control over day-to-day and month-to-month finances
    • Having the capacity to absorb a financial shock
    • Being on track to meet your financial goals
    • Having the financial freedom to make choices that let you enjoy your life

    Measured against that standard, money dysmorphia is a sign that your internal yardstick is misaligned — not that you’re failing with money.

    Five Steps to Bring Your Financial Perception Back Into Focus

    Addressing money dysmorphia starts with separating what you feel from what you can measure. These five steps help do that.

    1. Audit Your Actual Numbers

    Start with a clear picture of where you stand today. List your accounts, debts, monthly expenses, and savings rate so you can see your finances in one place rather than relying on impressions.

    A structured tool makes this easier. The Boldin Planner brings your income, savings, investments, and goals into a single plan so you can see whether you’re on track for retirement and other priorities. When the numbers are in front of you, the story that says “it’s never enough” gets harder to sustain.

    2. Identify Your Comparison Triggers

    Notice when money anxiety spikes. Is it after scrolling social media, talking with certain people, or reading about someone who retired early or built wealth fast?

    Write down the specific situations that set off comparison spirals and the thoughts that follow. “Everyone my age owns a home.” “We’ll never catch up.” Naming those patterns helps you treat them as assumptions to examine, not facts to accept.

    3. Build a Written Financial Plan

    A written plan translates your values and goals into concrete targets for saving, investing, and spending. It also gives you a framework for decisions: does this move me closer to or farther from the life I actually want?

    With the Boldin Planner, you can set retirement, saving, and lifestyle goals; model different retirement ages, spending levels, and Social Security strategies; and see how changes to contributions or spending affect your long-term projections. Vague fears are harder to hold onto when you’ve run the actual numbers.

    4. Work With a Financial Professional or Coach

    If money dysmorphia is causing serious distress or driving you to avoid important decisions, working with a financial planner, coach, or therapist who understands financial anxiety can help.

    A planner can stress-test your retirement plan and give you an outside perspective when your internal voice is catastrophizing. For some people, pairing financial planning with therapy — particularly approaches that address anxiety, perfectionism, or scarcity thinking — delivers the most durable reset.

    5. Track Progress Against Your Own Benchmarks

    Decide what financial success looks like for you, in your current season of life. Maybe it’s a six-month emergency fund, a paid-off high-interest debt, retiring at a specific age, or having enough flexibility to work less and spend more time with people who matter.

    Then measure against those benchmarks, not against friends, influencers, or viral success stories. Checking in on your savings rate, debt payoff, and retirement readiness on a regular schedule keeps you grounded in your own reality instead of chasing a moving external target.


    Related Reading

    If you recognize yourself in these patterns and want to go further:


    Frequently Asked Questions About Money Dysmorphia

    What is money dysmorphia?

    Money dysmorphia is a distorted view of your financial situation. People who experience it often feel behind, unsafe, or bad with money even when their numbers say otherwise. It can also show up as unwarranted confidence or overspending when finances are strained. The defining feature is a mismatch between financial perception and financial reality, and it can affect anyone regardless of income or net worth.

    Do I have money dysmorphia?

    People who experience money dysmorphia often feel behind financially despite having savings, avoid checking their accounts because it triggers anxiety, or compare their finances to others and consistently come up short in their own minds. Another sign is refusing to spend on things they can afford, or delaying retirement indefinitely because it never feels safe enough. These patterns can show up at any income level.

    What causes money dysmorphia?

    Money dysmorphia comes from a mix of social comparison, economic uncertainty, and internal beliefs about what financial security should look like. Social media and cultural fixation on extreme wealth can make ordinary financial progress feel inadequate. Past experiences with money, family messages about scarcity or wealth, and perfectionism can all intensify the distortion over time.

    Is money dysmorphia more common in certain age groups?

    Money dysmorphia is most common among younger adults, but it affects all age groups. A Credit Karma study found that 43% of Gen Z and 41% of millennials experience it, compared with 25% of Gen X and 14% of people 59 and older.

    How do you fix money dysmorphia?

    Start by getting your actual numbers in one place so you can separate what you feel from what’s measurable. From there, identifying comparison triggers and building a written plan around your real goals helps close the distance between perception and reality. Working with a planner or coach, and tracking your own benchmarks rather than other people’s, supports that shift over time. Most people who engage with the process make real progress — and a clearer picture of your finances is usually less scary than the one your anxiety has been filling in.

    Can wealthy people have money dysmorphia?

    Wealthy people and retirees with substantial savings can experience money dysmorphia as a persistent fear of not having enough, which often leads to chronic under-spending and delayed life decisions. A retiree with a seven-figure portfolio may still feel one bad market year away from disaster. That fear is real, but it often isn’t an accurate read of actual shortfall risk. A clear, evidence-based retirement plan that models real spending scenarios is what typically brings that fear into proportion.

    The post Money Dysmorphia: What It Is, Who Has It, and How to Fix It appeared first on Boldin.

    This post was originally published on this site

  • A New Senior Living Model for the Middle Market?

    A New Senior Living Model for the Middle Market?

    I recently toured Opus, an inspiring new senior living development in Newton, Massachusetts, and then had a conversation with its founder, Amy Schectman, on my Risking Old Age in America podcast.

    Amy explained to me how she had helped develop both a high-end senior living development, NewBridge on the Charles, and lower-income senior housing, Brown Family Life. With Opus, she was seeking to create housing for the often-overlooked middle market. She said that she and her team worked through many challenges in making the economics work without the prices they could bring for the higher-end market nor the subsidies available for lower-income housing. She feels that they can repeat this prototype elsewhere.

    Excerpts from Our Conversation

    Risking Old Age in America (ROA): The people at NewBridge, of course, have more wealth and there’s more money there, so I assume they are offered more services than at the other two places?

    Amy Schectman: No, I would not say that. They pay for it differently but, if you look at the core services, they are at all three places.

    What might be different? Newbridge has three dining facilities. You can eat in the deli or at one of two dining rooms. At Opus, you have one physical facility, but you’re going to have different kinds of meals. So it’s a little bit different, but I wouldn’t say more [services] at all.

    I think what we have done at 2 Life Communities is to define the paths to optimal aging. And we feel like we provide that entire package. I don’t think you can do more than that.

    ROA: So what are the parts of that path?

    Schectman: You need three…critical components to age optimally. The first is lifetime affordability. Housing is the biggest budget item [in] any…older person’s portfolio, but you have to think about what are you going to need later on too. They say [a large majority] of baby boomers are going to need significant home care for [a number of] years…If you’re in a private home, that’s really expensive because the minimum home health shift you can buy is four hours or five hours. So, at all of our places, we always make sure to structure the economics so that people have enough for their entire lives.

    The second piece that everyone has to have is social connection. If you don’t want to be lonely in your eighties and nineties, you have to be in a place where you’re making new friends and new connections. It’s inevitable that your networks otherwise shrink over time.

    And the third piece is navigating the home and healthcare system. I wish we had a system where nobody had any problems advocating for themselves to get all the care they need, but we don’t. At all of our campuses including Opus Newton, we have care navigators. When you need help, say coming home from [the hospital after] a hip replacement, or I don’t know whether I’m supposed to get help with meals, or how am I supposed to organize myself if I have a knee injury. Somebody that’s your partner helps you put all those pieces in place.

    A second level of how we organize things is all the activities that allow everyone to find their path into community. For you, it might be a book club, it might be a music event, for somebody else, it’s going be a dining program or a fitness program.

    You have to have an array of opportunities so everyone can find their way into community. That’s a constant at all of our campuses. At Opus Newton, we have an additional element, which is that everyone has agreed to volunteer at least 10 hours a month. Some of the ideas people have come up with, I would say [provide residents with more options] than any place in the country: We have two theater troupes, one that’s doing storytelling, one that’s putting on plays. We have a chorus. We have a canasta club, bridge club, mahjong club. We have a class on nature. All resident-led.

    My Concluding Thought

    During our conversation, Schectman also explained to me how it took her and her team eight years to develop a model that would work for the “missing middle.” They recognized that this group, at least in the Boston area, often has substantial home equity but is scared of a long-term financial commitment. So they worked to keep the monthly carrying costs moderate while the buy-in is substantial, but partially refundable at death or upon moving out. Now that they have created the model, they hope to replicate it in other locations.

    Listen to our entire conversation here.

    For more from Harry Margolis, check out his Risking Old Age in America blog and podcast.  He also answers consumer estate planning questions at AskHarry.info.  To stay current on the Squared Away blog, join our free email list.

    This post was originally published on this site.

  • Two Simple 401(k) Lessons for New College Grads

    Two Simple 401(k) Lessons for New College Grads

    One of the most fortunate events of my life was my first job after college at the Center for Retirement Research at Boston College (CRR). Not because of the salary — I think I earned less than $40K. What was fortuitous were the early lessons I learned about building toward a secure retirement.

    Those lessons boil down to two simple but critically important points I urge you to share with any new graduate:

    1. Contribute to a retirement plan    
    2. Invest aggressively

    Simple, yes — but in a world of financial complexity, these two things do most of the heavy lifting toward long-term retirement planning.

    My first project at the CRR was building a game where a fictional character named Sally makes financial decisions at different ages — how to invest, how long to work, and when to take Social Security. One key decision at each stage was how much to allocate between stocks and bonds. We modeled projected outcomes using decades of historical data.

    Playing this game with volunteers revealed two consistent findings. First, Sally fared better the more she allocated to stocks early in the game. Over long periods, stocks have outperformed bonds, albeit with tons of variability. The game only allowed decisions every 10 years, which meant Sally couldn’t panic during downturns, and staying invested paid off.

    Second, consistent contributions mattered enormously. As we wrote in our findings 20 years ago, because Sally hadn’t accumulated much wealth yet, her annual contributions overshadowed investment returns in driving 401(k) growth early in her career.

    Those lessons have stuck with me. I contribute regularly to my 401(k) and keep an all-stock portfolio, even at age 43.

    Here’s my message to new grads: I know finances are hard early in your career. You may not be earning much, you likely have student loans, you want to save for a home, and you still want to go out and have fun. These are all competing claims on a small paycheck.

    But please contribute to whatever retirement plan your employer offers. If your employer matches your contribution, like most companies do, try to contribute the highest amount that’s matched. The employer match is free money you can’t afford to leave on the table.

    And invest aggressively. Worried about geopolitical turmoil, oil prices, or whatever the current fear du jour is? Let it go. Even though it might be terrible for workers and the economy more broadly, one of the best things that could happen to a 20-something investor is a market downturn. Even after the seemingly catastrophic 50-percent drop that occurred during the financial crisis in 2008, the stock market recovered within a handful of years.

    The long-term average return on the U.S. stock market is about 10 percent (nominal) per year. Some years will be plus 30 percent and some will be minus 30. But that long-term average includes the Great Depression, the onset of World War II, the stagflation of the 70s, Black Monday 1987, the dot-com bubble, and the 2008 financial crisis.

    That’s why I suggest you put as much as you comfortably can into your 401(k) and invest heavily in U.S. and international stock markets. The precise mix – large vs. small cap, value vs. growth, U.S. vs. international – matters less than simply being invested. If you’d rather simplify the decision further, a target-date fund works well. For example, a target 2070 fund currently holds less than 10 percent in bonds with the rest in global stocks. Shield your eyes, plug your nose, cover your ears, and stay the course.

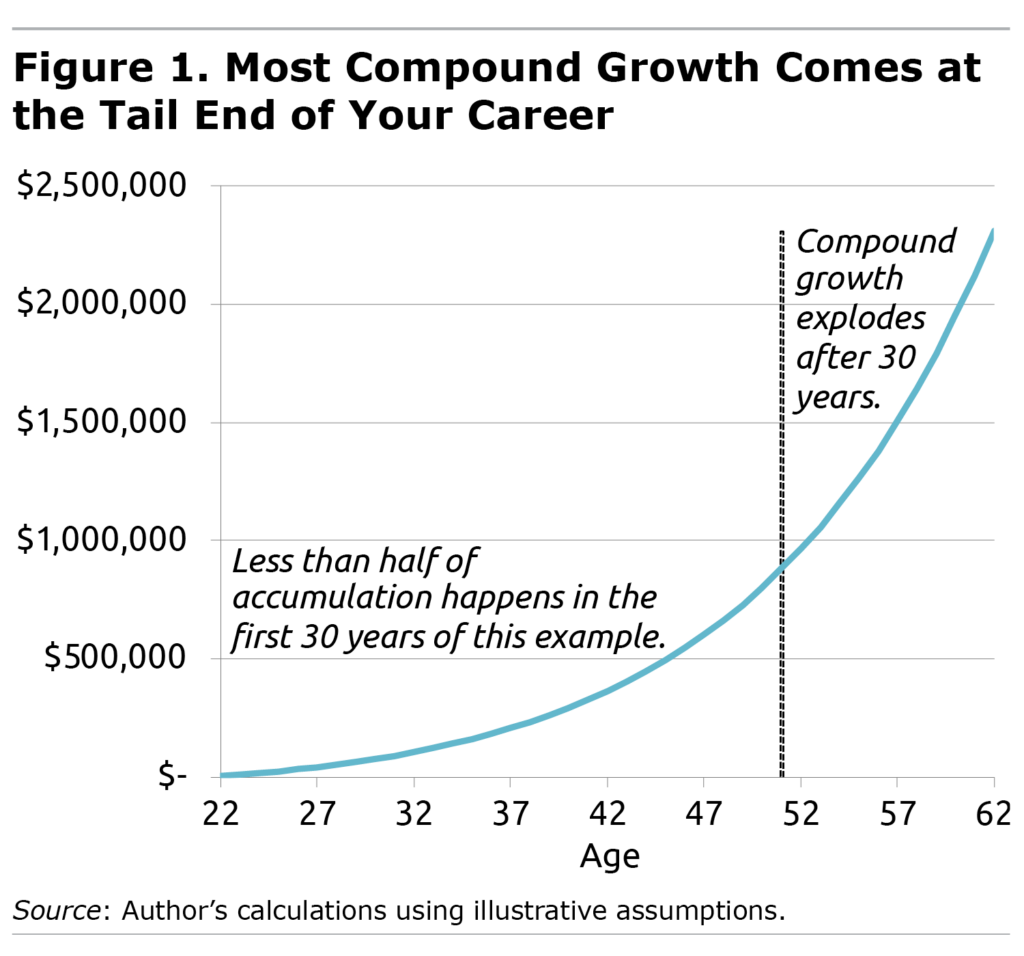
    Growth will feel painfully slow at first (we named our game Get Rich Slow for this reason). But compounding accelerates dramatically as balances build, and it’s hard to catch up if you skip the early years.

    Say you’re 22 and contribute $5K per year, increasing your contribution by 5 percent annually, with a 7-percent nominal rate of growth (simple assumptions for the sake of illustration). At 31, your savings are still under $100K. At 45, they’re under $500K. Then compounding takes over: you have $1 million by 53 and $2 million by 61 (see Figure 1). None of that is possible without those early contributions.

    The simple math is this. When you have $5K in your retirement account and it earns 7 percent, the growth is $350. Not exactly life changing. But when you have $2 million in your account and you earn 7 percent, the growth is $140,000.

    The lesson from the CRR has never left me. If you are early in your career, or even if you are mid-career with 20-plus years until retirement, history says be aggressive and contribute early and often. It feels slow, but I’ve seen it work time and again, both in our research and in real life.

    Luke Delorme, CFP® is Director of Financial Planning at Tableaux Wealth in Great Barrington, MA (www.tableauxwealth.com), reachable at luke@tableauxwealth.com. To stay current on the Squared Away blog, join our free email list.

    This blog post is for informational and educational purposes only and should not be considered financial advice. Consult a qualified professional for advice specific to your situation.

    This post was originally published on this site.

  • Can Technology Make Home Care Services More Affordable?

    Can Technology Make Home Care Services More Affordable?

    Neal K. Shah, the founder of CareYaya, a company that links students in the healthcare field with seniors needing assistance, has some strong opinions about elder care in the United States. The word Yaya means ‘grandmother’ in Greek and ‘caregiver’ in Swahili and Thai. As an acronym, it also means ‘You Are Your Advocate.’

    In a recent podcast, Mr. Shah told me about how CareYaya works and how we should transform elder care in the United States. Here are some extracts from our conversation:

    Risking Old Age in America: Why don’t we start [with] what CareYaya is and how you got into this business?

    Neal K. Shah: We are actively working hard to solve the elder care crisis by connecting people with very affordable care, probably the most affordable home-based care in America – approximately $20 an hour as compared to typical agencies charging $35 to $40 an hour.

    We connect everyone digitally through an online platform. Many…call it the “Uber of caregiving.” We have mobilized a workforce of over 50,000 college students across the country to care for the older adult population.

    ROA: I recently had a guest on who runs a home health agency. She would argue that they provide value added in terms of supervision and coverage if someone can’t make it. They also handle all the employer obligations, including FICA stuff and workers’ comp. How does that correspond with what you’re offering?

    Shah: We don’t directly compete with the home care agency industry just because the market is so large. Depending on which stats you look at, home health care is approximately a $500 billion per year market. The Rand Corporation put a study out that it’s one of the biggest markets in the country that…[often] operates in the gray market. So [a large share] of the market books informally.

    Of the $40 an hour that you’re paying [to an agency], something like $5 is going to franchise royalties, something like $5 is going to the local agency’s profit margin. Another $5 is going to extremely manual booking and scheduling and a massive team of people doing work that can be done better with technology. And then another $5 to $8 is going into advertising – a lot of Facebook and Google ads – and to local salespeople schmoozing with doctors and nurses.

    You just have this insanely inefficient infrastructure where more than $20 per hour of what you’re paying is wasted on frivolous stuff. And the person doing 99% of the work is capturing less than half.

    . . .

    ROA: You have commented that the United States is good at healthcare, but not good at “social” care. What do you mean by that?

    Shah: Health care plus social care…spending [is] around…18 to 20% of GDP per year. That’s also true of parts of Europe and parts of Asia. But in that distribution in the US the majority of that money is spent on medical care and a minimal amount on social care. We have great MRIs, PET scans, and all these pharmaceuticals. But [outside of Medicaid] there’s virtually zero spending from a governmental perspective on helping that person stay at home, helping that person stay safe, getting caregivers, that’s all out of pocket.

    So that’s what I mean, that these social services are grossly underfunded.

    . . .

    ROA: And you say that the longevity grift isn’t about living longer, it’s about the wealthy trying to buy their way out of being human. There are a lot of wealthy people investing in in anti-aging stuff. There are some doctors who argue we ought to be researching aging, not specific diseases or one organ at a time. You’re a critic of that approach.

    Shah: Yes. The spoiler: it won’t work for a couple of reasons. One, from a social impact perspective, aging and caring for the currently aging population is a now thing. We can’t wait.

    Second, these science experiments and fantasies of people I think have a low probability of success in my opinion. So there’s an insane overallocation of funding to something that, in my opinion, is frivolous and unlikely to happen.

    Listen to our entire conversation here.

    Topics

    00:00 Why Getting Care Help Is So Frustrating (Caregiver Reality Check)

    00:26 Meet Neal Shah & the Mission Behind CareYaya

    01:01 How CareYaya Works: Healthcare Students, Digital Booking, Lower Cost

    02:19 What Kind of Care They Provide (Home Care vs. Home Health)

    03:29 Why Home Care Is So Expensive: Middlemen, Markups, and Bad Experiences

    06:02 CareYaya’s “Costco Model”: Tech Efficiency, Reliability, and Better Pay

    08:03 Employer Paperwork & the Gray Market: Taxes, Workers’ Comp, and DIY Tradeoffs

    09:56 Neal’s Origin Story: From Hedge Funds to Family Caregiving

    12:48 Funding & Business Model: For-Profit, No Fees (Yet)

    13:54 What Are Impact Funds? Patient Capital for Long-Term Social Change

    16:23 Switching Gears: The U.S. Is Great at Healthcare, Bad at Social Care

    16:45 Why the U.S. Underspends on Social Care (Dementia & Cancer at Home)

    18:02 The Hidden Army of Family Caregivers—and the Trillion-Dollar Burden

    18:36 Boomers Turning 80: The Coming Care Crunch & Workforce Dropout Risk

    19:34 Who Should Pay? Private Sector, Tax Breaks, and Employer Elder-Care Benefits

    21:42 Preventing Hospitalizations: Loneliness, Home Support, and Medicare’s Incentives

    23:17 Medicare Advantage Critique and the Fragmented Payer Problem

    24:21 The “Longevity Grift”: Why Anti-Aging Hype Misses the Real Crisis

    28:37 Policy Advice: Invest in Home-Based Care and Build the Care Workforce

    30:29 Advice for Boomers: Plan Early, Save More, and Rethink HSAs

    33:05 Closing Thoughts and Farewell

    For more from Harry Margolis, check out his Risking Old Age in America blog and podcast.  He also answers consumer estate planning questions at AskHarry.info.  To stay current on the Squared Away blog, join our free email list.

    This post was originally published on this site.

  • Why You Might Want to Hire Home Health Aides Through an Agency – Despite the Cost

    Why You Might Want to Hire Home Health Aides Through an Agency – Despite the Cost

    One of the challenges of obtaining home health care for seniors is its cost, which is often beyond the means of people and their families. The cost barrier is especially true of aides hired through private home health agencies, which is often considerably more expensive than hiring an aide directly.

    On my Risking Old Age in America podcast, I recently talked with Wendy Adlerstein, co-owner of First Light Home Care in west suburban Boston, about the benefits of hiring assistance through an agency and what goes into the extra cost. She also calls for statewide licensure of home health agencies to make sure they all provide what they promise.

    Here are some extracts from our discussion:

    Risking Old Age in America (ROA): How difficult or easy is it to recruit home health workers?

    Wendy Adlerstein: It’s definitely a laborious process. We have a team specifically dedicated just for recruiting and hiring. They screen hundreds of candidates. And we really only hire about 3 percent of the people we talk to.

    ROA: How has the recent immigration crackdown affected your recruiting or your current employees?

    Adlerstein: Unfortunately, we definitely see that there has been a shift. Certainly the pool of caregivers that are available is shrinking. One of the big things that we also see is the renewal process for employee authorization documentation is extremely slow, if not completely stopped.

    ROA: How much do you pay your employees?

    Adlerstein: In this region, agencies pay caregivers between $19 and $24 an hour.

    ROA: And you pay FICA and other benefits?

    Adlerstein: Yes. They’re all W-2 employees.

    ROA: I understand that Massachusetts is one of the few states that doesn’t regulate home health agencies and that people in your field actually would prefer to have regulation. Why is that?

    Adlerstein: Yes, that is a very big topic right now because there’s a bill in the legislature that is getting some traction this time around. It would create standards that replicate what we are already doing. Unfortunately, there are agencies out there that do not follow the same guidelines. This can create some safety issues and concerns for anyone opening their home and letting someone come in without all the proper oversight and background checks. Licensure would standardize and professionalize home care in Massachusetts.

    Listen to the entire conversation here.

    Topics

    00:29 Overview of the Home Healthcare Agency

    01:13 Benefits of Being Part of a Franchise

    01:52 Wendy’s Background and Journey

    02:54 Differences Between Private and Nonprofit Home Care

    03:38 Typical Clients and Home Health Aides

    04:59 Recruitment and Vetting Process

    06:15 Impact of Immigration Policies

    08:46 Employee Compensation and Client Costs

    14:09 Regulation and Licensing in Home Care

    20:12 Challenges and Recommendations 24:50 Conclusion and Final Thoughts

    For more from Harry Margolis, check out his Risking Old Age in America blog and podcast.  He also answers consumer estate planning questions at AskHarry.info.  To stay current on the Squared Away blog, join our free email list.

    This post was originally published on this site.

  • How Much Will Your Long-Term Care Needs Cost? It Depends on How Average You Are

    How Much Will Your Long-Term Care Needs Cost? It Depends on How Average You Are

    The consulting firm Milliman recently published its 2025 Long-Term Care Index, calculating that – on average – 65-year-olds should set aside $135,000 for their future high-intensity long-term care needs.

    Great Variability

    While an average figure can be a helpful anchor point, Milliman’s estimates show substantial variability based on gender, location, and health status, among other factors. For instance, the average cost for women is $171,000 and that for men is $98,000, largely because women live longer. As a result, they may need care for a longer period of time and are less likely to have a spouse available to assist them at no cost.

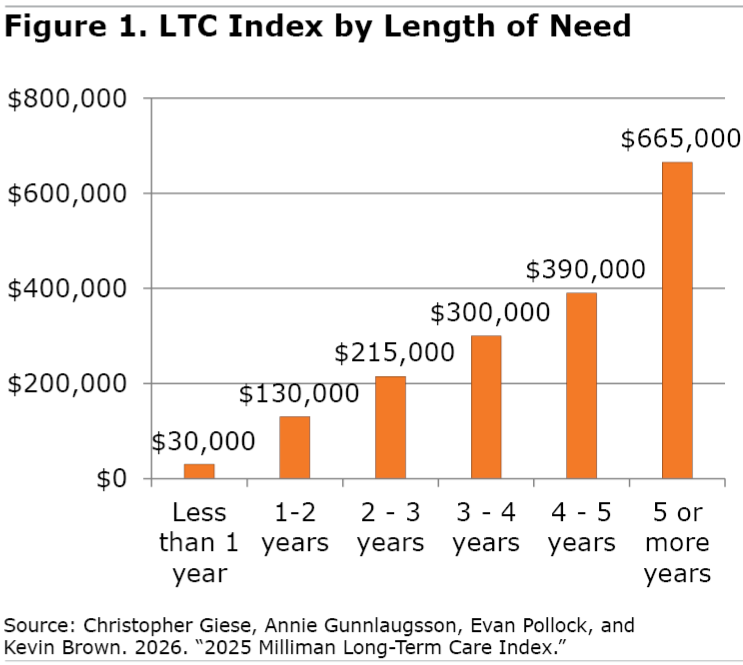
    According to Milliman, almost half of men and four out of ten women will need no paid care at all during their lives. Another quarter of men will receive less than a year of paid care, leaving just 29 percent requiring more than a year of paid care. Women, on the other hand, are much more likely to need care for an extended period with 41 percent facing more than a year and 14 percent needing five years or more, which will on average cost them $665,000 (see Figure 1).

    I should note that the Milliman figures assume all care is paid care. The Center for Retirement Research at Boston College has estimated that families typically provide at least half of the care hours, even for those with high needs. Milliman also doesn’t say how these costs are paid, in particular whether they include Medicaid-covered care or only amounts paid out-of-pocket.

    Location, Location, Location

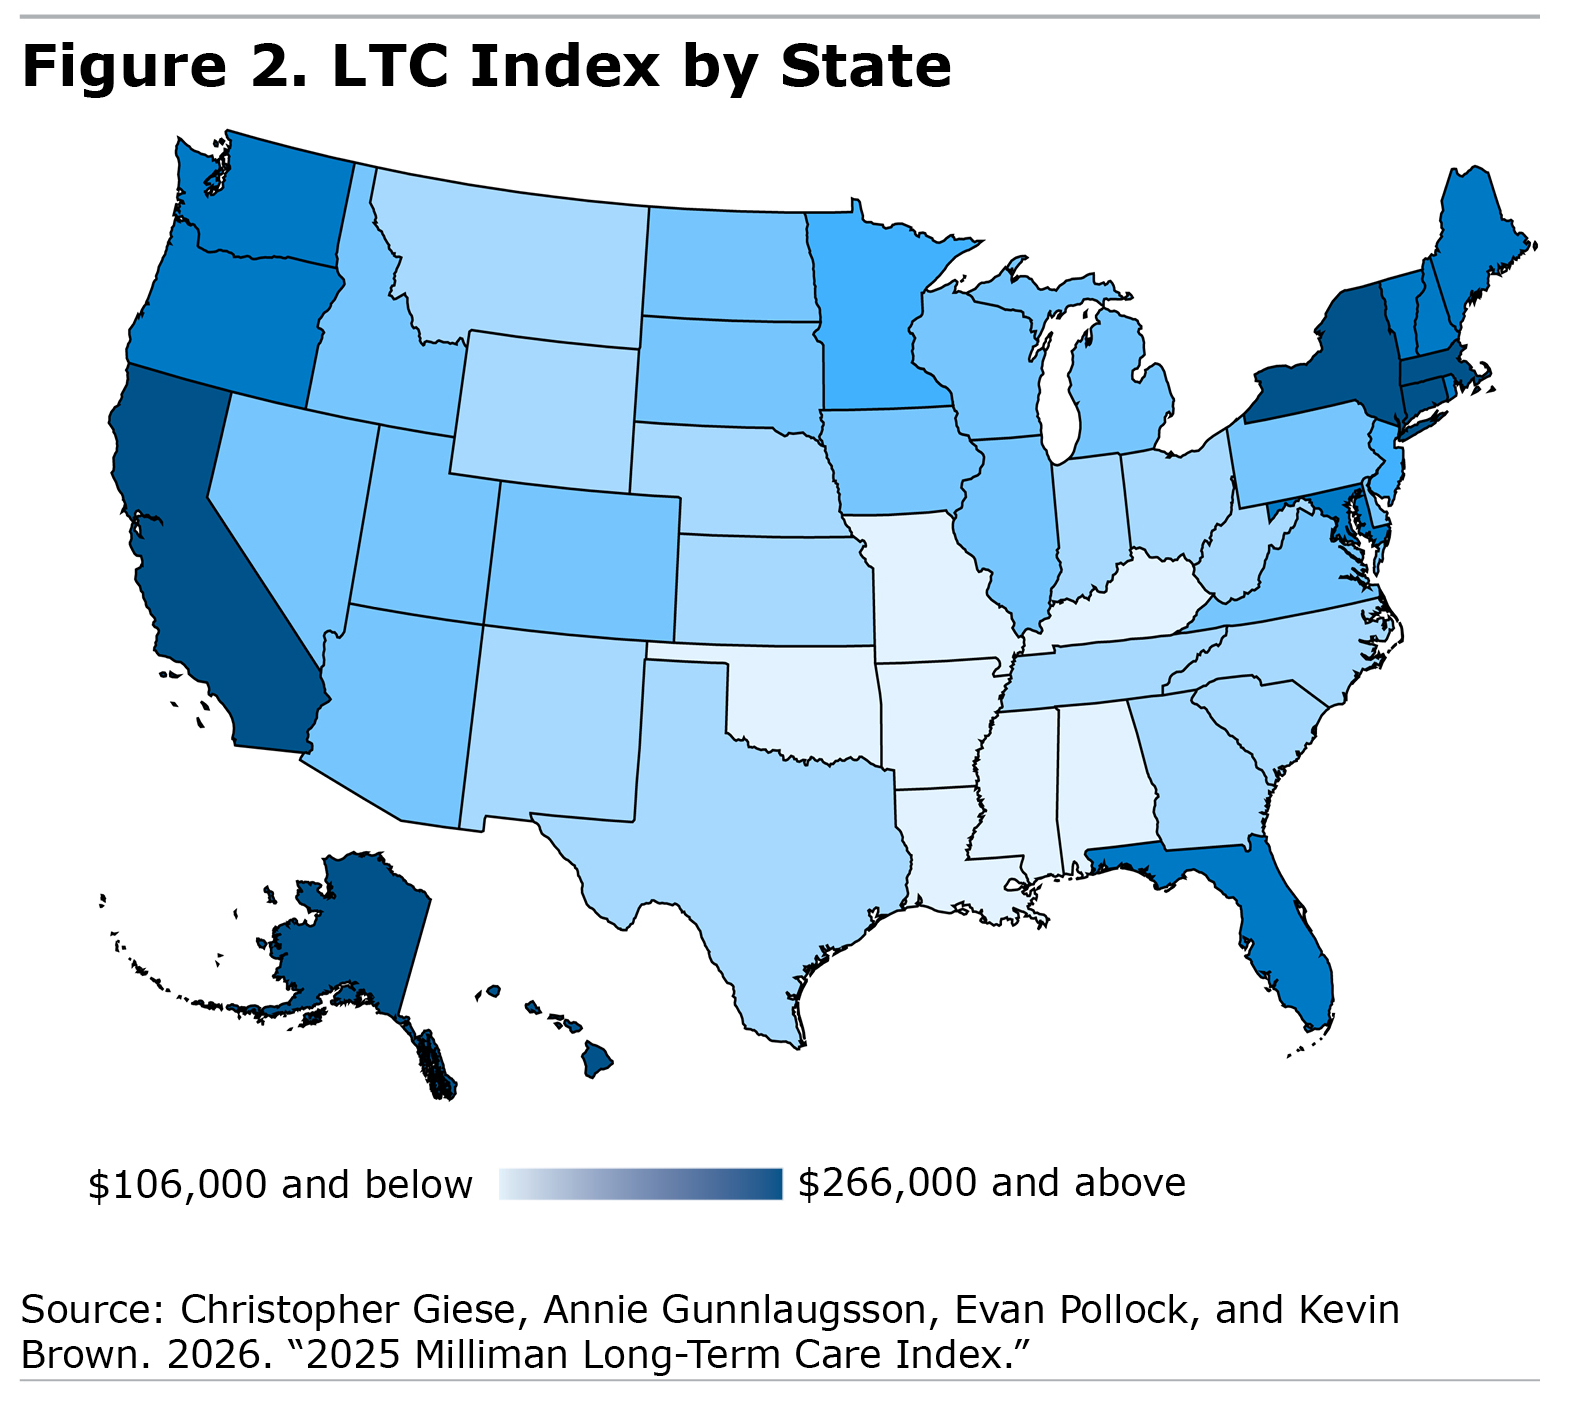
    Costs vary considerably by type of care needed – home health, assisted living, or nursing home – and by location. Location matters not only in terms of costs of care but also longevity and health. People live longer (and, thus, may need care longer) in some states – such as Hawaii, California, Washington, Florida and New Hampshire – than others – such as Mississippi, Alabama, West Virginia, Louisiana and Kentucky.

    On the other hand, people who are healthier tend to need care for less time. Milliman highlights Colorado, Montana and Hawaii as states where residents are least likely to need any paid long-term care and Montana, again, along with Arizona and Oklahoma as the states where people need the shortest duration of care. At the other end of the spectrum, those with care needs in Hawaii, Connecticut and New York receive care for the longest periods of time.

    Combining all these factors – so that the cost of LTC services, the likelihood of needing services, and the duration of the needs are accounted for – Figure 2 shows Milliman’s ranking of the average long-term care costs per state (see Figure 2).

    The most expensive states (dark blue) are on the West Coast and in the Northeast, where average costs are about twice the national average. The least expensive are largely in the South-Central region (light blue).

    A further variation on how much 65-year-olds need to set aside for their care is the anticipated rate of return. The $135,000 average is based on an average investment return of 4.35 percent. Using a higher figure of 7 percent, the average 65-year-old would only need to set aside $74,000, but using a lower return of 3 percent, they’d need $187,000 in the bank.

    What Does This Mean for You?

    For individuals and families planning for future long-term care costs, it can be difficult to anticipate the need. I’ve written before about the factors that affect the need for paid long-term care, including overall health, family history, and family situation.

    But the $135,000 figure seems like a good starting point. Increase that number if you live in a high-cost state, have a family history of dementia or other illnesses that may require a long period of assistance, or if you do not have family members who could help.

    Your existing health may affect the figure both positively and negatively. If you are already suffering from a debilitating chronic disease that you could live with for many years, such as Parkinson’s, you can anticipate needing more money. But if you have a form of cancer that may shorten your life but not lead to a long period of disability, you may need considerably less.

    An Insurance Solution?

    My biggest take away from the Milliman report is that we need a universal long-term care insurance program since we have great uncertainty about individual needs combined with relative certainty about those of the entire elder population. In addition, while a small minority of seniors can afford the cost of their care, whatever it may be, a majority cannot.

    According to the Federal Reserve, the median retirement savings of 65- to 74-year-olds in the United States is $200,000, meaning that half have less than this amount. Individuals ages 75+ have median savings of just $130,000. In short, most baby boomers likely do not have enough money to pay their future long-term care costs.

    The cost for covering long-term care needs would be significantly less if we started contributing at an earlier age through a national insurance plan. At its 4.35-percent rate of return, Milliman calculates a 35-year-old would only have to set aside $38,000, on average, to cover their future long-term care costs, almost $100,000 less than a 65-year-old. Of course, few 35-year-olds are thinking about their future care needs, but collectively we can approach this challenge. In fact, Washington State has set up such a program, which provides a base layer of long-term care protection for its workers (up to $36,500); and it is exploring ways to allow people to buy additional long-term care insurance at a group rate. Several other states, including Massachusetts, are already exploring similar programs.

    For more from Harry Margolis, check out his Risking Old Age in America blog and podcast.  He also answers consumer estate planning questions at AskHarry.info.  To stay current on the Squared Away blog, join our free email list.

    This post was originally published on this site.

  • Medicaid Coverage of Home Health Care is Growing: But Will the Trend Last?

    Medicaid Coverage of Home Health Care is Growing: But Will the Trend Last?

    Most seniors want to stay in their own homes when and if they need care. In response to this desire and the generally lower cost of home health and assisted living services compared to nursing home care, Medicaid has expanded its coverage of home-and-community-based services (HCBS) over time.

    According to the Centers for Medicare & Medicaid Services, in 2023, 8.4 million Medicaid beneficiaries received assistance paying for care at home or in assisted living facilities – a substantial increase of 8 percent from 7.8 million in 2022. In comparison, 1.5 million beneficiaries received institutional care – mostly in nursing homes – a more modest 3-percent increase over 2022. However, the overall costs for institutional services grew by 17 percent compared to 13 percent for HCBS.

    Growing HCBS Coverage

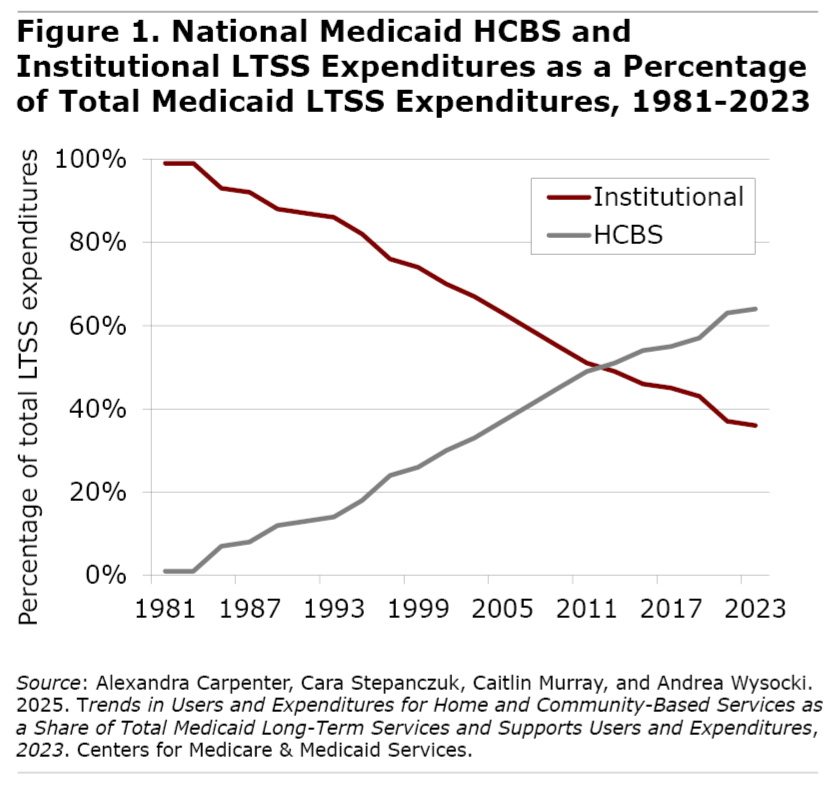
    HCBS accounted for almost two-thirds of all spending on long-term services and supports (LTSS). For historical perspective, in 1981 only one dollar out of a hundred spent by Medicaid for LTSS went to HCBS, rising to half of LTSS spending by 2013 and continuing to grow thereafter (see Figure 1).

    State Variation

    Large variations exist in Medicaid coverage of HCBS by state in large part because such coverage is discretionary, in contrast to nursing home coverage, which is mandatory. Ninety-nine percent of Medicaid beneficiaries in Oregon and Wisconsin receiving LTSS were doing so at home or in assisted living facilities, in contrast with just 56 percent in Kentucky and 61 percent in Mississippi.

    In terms of spending, Medicaid costs for HCBS constituted 95 percent of LTSS costs in Wisconsin as compared to just 36 percent in Arkansas. In other words, only 5 percent of Wisconsin’s expenditures on LTSS are going to nursing homes in contrast with 64 percent of Arkansas’ spending.

    The Future?

    Many people who work on long-term care policy are concerned that the $900 billion in Medicaid cuts in the “One Big Beautiful Bill” will reverse the trend towards more coverage of HCBS. While a lot of the bill’s cuts are aimed at younger beneficiaries, in large part by instituting work requirements, others, such as limitations on so-called provider taxes, are not. States will have to find ways to make up the shortfall in revenue or reduce services. One way may be to cut home health and assisted living coverage, since they are optional under the federal Medicaid rules.

    For more from Harry Margolis, check out his Risking Old Age in America blog and podcast.  He also answers consumer estate planning questions at AskHarry.info.  To stay current on the Squared Away blog, join our free email list.

    This post was originally published on this site.

  • New Tax Break for Seniors

    New Tax Break for Seniors

    Part of the recently passed tax bill includes what the administration is calling “No Tax on Social Security.” The bill does not directly remove taxes on Social Security payments, but it does provide an additional deduction for seniors under certain income limits. This provision may effectively reduce – or, in some cases, even eliminate – federal taxes paid by people ages 65+.

    First of all, it should be noted that this tax break worsens the tenuous fiscal condition of Social Security. Social Security actuaries estimate that the new tax provisions will move up the trust fund depletion date by roughly six months – from the 3rd quarter to the 1st quarter of 2034.

    Nevertheless, current beneficiaries will see the benefits of lower taxes. This blog post looks at how the new deduction works and how it may impact your federal income taxes.

    How Deductions Work

    To understand the mechanics of this new tax break, it helps to know how deductions work. The following is a simplified explanation of the standard deduction (this is not tax advice).

    You start with gross income, which is the total of all sources of taxable income. This amount typically includes work income, most pensions, taxable investment income, and up to 85 percent of your Social Security income. The taxable share of your Social Security is based on what is called “combined income,” which equals half of your Social Security benefit, plus nontaxable interest, plus all other taxable income. Once combined income is greater than $44,000 for married couples filing jointly or greater than $34,000 for single filers, 85 percent of Social Security benefits are taxable. (At lower thresholds, people are taxed on up to 50 percent of their benefit income; below these thresholds, benefits are not taxed at all.)

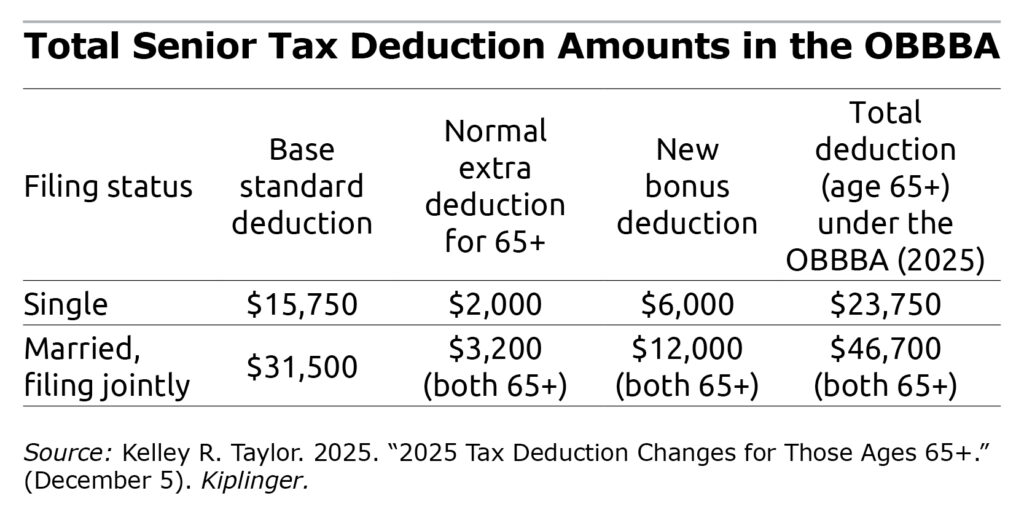
    After totaling your gross income, including taxable Social Security, you subtract deductions. You have the option of tallying up individual items and itemizing deductions, but most people do better by taking the standard deduction. People ages 65+ also receive an extra standard deduction. The new tax bill adds to this already increased standard deduction, bringing the total to $23,750 for singles and up to $46,700 for married couples filing jointly (see Table). It is worth noting that this new deduction is temporary – it is available from 2025 through 2028. This potentially whopping standard deduction is then subtracted from gross income to arrive at taxable income.

    Impact of the New Provision

    The new provision doesn’t explicitly remove federal taxes on Social Security, but it does have the same effect for many people, reducing taxable income by $6,000 per person for those ages 65+. For lower-income retirees who are reliant on Social Security, this might be enough to all but eliminate their entire federal income tax liability. Note, though, that lower-income households below certain thresholds were already untaxed on Social Security. For these households, the additional deduction will reduce other taxable income.

    Let’s look at how this might impact income taxes. Take a single woman over age 65. Say she receives a taxable pension of $30,000, investment income of $10,000, and Social Security benefits of $24,000 (85 percent of which is taxable). That puts her in the 12-percent federal tax bracket. Incorporating the new $6,000 tax provision will effectively reduce her federal tax bill by $720.

    Pay Attention to Income

    An important caveat to this new provision is that it is phased out for single taxpayers with incomes over $75,000 and married filers with incomes over $150,000. The phaseout is $60 for each $1,000 over the threshold. It is fully phased out at $175,000 for single filers and $250,000 for joint filers.

    Bigger Refunds in 2026

    Although the new tax provision does not explicitly eliminate taxes on Social Security, it will reduce taxes for many filers age 65+. If you’ve paid estimated taxes throughout the year or had taxes withheld on your income, you may end up getting a bigger refund (or owe less) in 2026.

    Luke Delorme, CFP® is Director of Financial Planning at Tableaux Wealth in Great Barrington, MA (www.tableauxwealth.com), reachable at luke@tableauxwealth.com. To stay current on the Squared Away blog, join our free email list.

    This blog post is for informational and educational purposes only and should not be considered financial advice. Consult a qualified professional for advice specific to your situation.

    This post was originally published on this site.