Trish and Brooke Harwood have cruised all over the world, but their most recent voyage — a two week sailing from Lisbon to Rouen (and several added days at each end) — stood out. This time they brought along their two sons and their partners, continuing a family travel tradition that started with Trish’s own parents and her siblings when she was just eleven. The Harwoods and their sons/families have just five cruises together under their belts, but are looking forward to more.
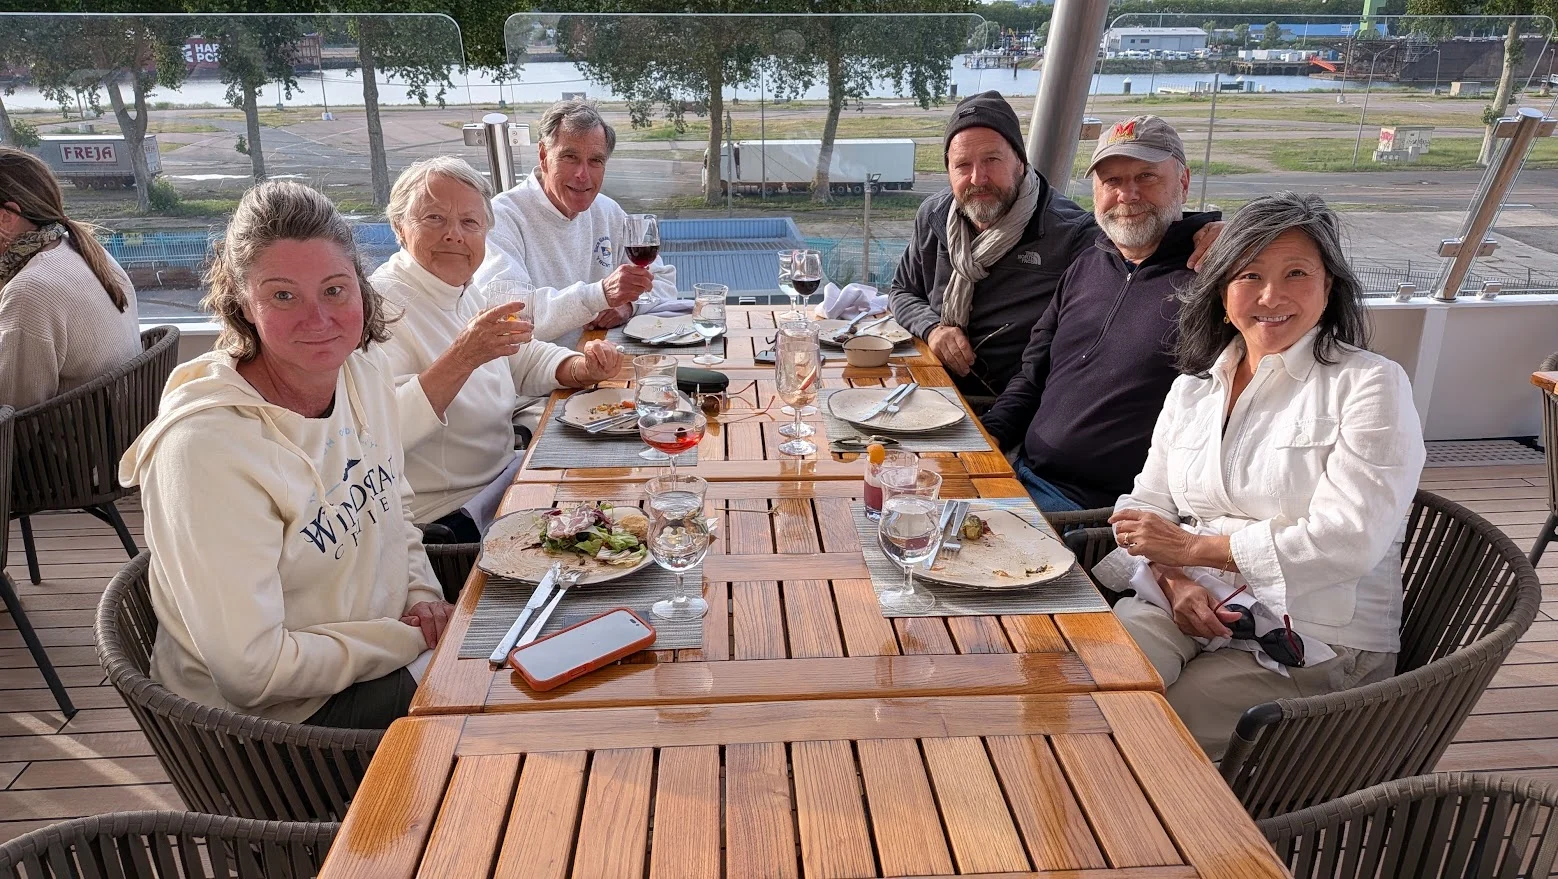
Yacht Club Member Trish Harwood carries on her family tradition of multi-generational cruising on Windstar./
“One of the reasons we keep this tradition going is that we’ve learned that our kids, who range in age from 55 to 64, are such a treat to share destinations and experiences with,” Trish says. “And yet it’s a very different experience, even on a familiar ship, from our usual travel as a couple. On those trips, we’re more likely to seek out other guests and participate in more onboard activities. Here the focus is family.”
The biggest difference this time around? “I certainly put more work into the pre- and post-cruise planning,” she says.
The Harwoods are hardly alone in prioritizing trips with their adult kids and, down the road, a post-graduation trip with a grandchild, is already on the horizon. Multi-generational travel is having a moment: in the 2026 Virtuoso Luxe Report, the two strongest motivations to travel were spending time with immediate family and going on multigenerational trips.
It’s easy to see why cruising is such a natural fit for family travel, Trish adds. “Once you’ve identified your ship and itinerary, the heavy lifting is already handled. There’s no worrying about dinner reservations or where you’re going to stay, and the ship’s shore excursion department handles activities in port.”
This is the fifth trip the Harwoods have planned with one or both of their sons, and Trish has picked up plenty of wisdom along the way. Her first rule: “We’re talking vacations, not family reunions, which have different needs and protocols. These are trips with our adult children, not kids — and they’re our guests.”
Here are her top tips for planning a multi-generational cruise of your own:
Trip planning
Start with a low-pressure suggestion: “We’re going to the Caribbean — would you be interested in joining as our guests?” Or “we’re thinking of visiting the Baltic; is this something you’d be interested in?”
Be clear about financials from the start — who’s paying for what? Major expenses include airfare, the cruise itself, pre- and post-cruise transfers, and accommodations and meals on land.
Air travel can be the trickiest piece, especially with limited seats and choices lately. I coordinate with the family and usually book everyone’s flights. But on one trip a couple couldn’t decide when to fly and it became frustrating. I finally said, “Here’s what our flights cost. I’ll send that amount to your bank account and you decide how to get there and book it yourself.
Whichever approach you take, make sure everyone is treated equally. If one couple can’t join a trip, we make sure a similar trip is offered another time.
Think carefully about timing. In our family, one couple is retired, and one still works — how much vacation time does the working couple have? If it’s limited, they might only join for part of the trip. Is the destination “good” (weather, crowds, etc.) during the window your kids can get away? If not, are you willing to adjust your own plans?
Setting expectations
Talk through goals and expectations before you leave. What do you, as host, expect? What do your kids — or teenage grandkids — want from the trip? The couple still working will likely be exhausted just getting to the airport on day one, while the retired among you can’t wait to start sightseeing.
This goes beyond schedules, too. On a trip to London, your teenage granddaughter might decide shorts, a tee shirt, and flip-flops are perfectly appropriate; you may see it differently. She might think hotel room service is the height of luxury, while you’re yearning for a good pub meal. Setting expectations on both sides upfront can save friction later.
On vacation together
On a family cruise, days in port everyone chooses whatever they want to do. On a stop at Guernsey, an e-bike tour was a big hit for one member of the group./Shutterstock
Let everyone keep their own daytime schedule and meet up for cocktails and dinner. Some like to sleep late, some want to sightsee early or sunbathe. Some like bike tours, others prefer museums, gardens or stately homes. It’s not a hard rule — on a small ship like Windstar, you’ll often end up at breakfast together, or a couple gets invited to dine with new friends — but daytime freedom gives everyone flexibility while keeping evenings as family time.
Expect dining preferences to shift across generations. We’ve noticed the younger generation tends to prefer more casual restaurants, so we adjust accordingly.
Stay easily reachable when you’re apart. A family WhatsApp thread keeps everyone in the loop — “A great table just opened up at Star Grill, anyone interested?” or “Just caught an Uber, back on board in 15 minutes” — so plans (like dinnertime) can shift in real time.
As host, decide how much responsibility you’re taking on for everyone’s comfort. With just the two of us, it’s easy — if something goes sideways, Brooke and I sort it out together. With six people, even agreeing on a restaurant and getting a reservation can get complicated. And where two of us would normally grab a train, taxi, or Uber from airport to hotel, with six I add van transfers to the plan.
A good example of our different interests is a review of the hundreds of photos we as a group posted on Google Photos during our three-week trip. Some were cathedrals and architectural while others were botanical gardens; some were landscapes while others were monuments or battlefields. All of us posted shots taken in fresh markets and of food! In viewing them it quickly became apparent whose interest was reflected in our growing album — and it got so we could identify the photographer by the subject.
And last, but by no means least:
Don’t hesitate to ask a fellow passenger to take photos of you as a group … otherwise someone is always left out (unless you like selfies).
Have you traveled as a multi-generational family? Care to share any tips? And if you’re planning a trip like this and have questions, leave them in the comments below (scroll way down!) and we’ll get you answers.
During my old corporate job I lived in a Marriott long enough to be invited to the staff Christmas party. I suspect that says more about my travel schedule back then than about my charm, but the habit stuck. These days Jess and I still book a lot of hotels, enough that I hold Marriott…
We all already know this: Italy is a beautiful country with extensive history and dramatic scenery and yet what keeps us coming back (and we’ve visited both on-land trips and via Windstar cruises from summer to winter) is its culinary and vinophile traditions (among others). It’s no coincidence: Windstar’s decade-long partnership with the James Beard Foundation puts that same regional, chef-driven approach onboard, too. Whether the dishes are familiar or not, an Aperol Spritz cocktail, pictured above, simply doesn’t taste the same at home as it does at a sidewalk cafe in Taormina.
Whether you’re planning your first trip to Italy — or considering a repeat visit — here are 15 of our favorite dishes to try, ranging from north to south and in between. Did we miss your own special dishes? Drop us a note in the comments.
At a Glance: 15 Italian Dishes by Region
#
Dish
Region
Course
1
Homemade Regional Pasta
Nationwide
Primo
2
Authentic Gelato
Nationwide
Dolci
3
Cappuccino and Espresso
Nationwide
Digestivo
4
Ossobuco
Milan, Lombardy
Secondo
5
Risotto
Northern Italy
Primo
6
Pesto alla Genovese
Liguria
Primo
7
Polenta
Milan, Turin, Venice
Contorni
8
Florentine Steak
Tuscany
Secondo
9
Ragù di Cinghiale
Tuscany
Primo
10
Ribollita
Tuscany
Primo
11
Spaghetti alla Carbonara
Rome
Primo
12
Truffles
Tuscany, Umbria, Piedmont
Primo/Secondo
13
Margherita Pizza
Naples
Primo
14
Bottarga
Sicily
Antipasto
15
Arancini and Supplì
Sicily & Rome
Antipasto
How to Read an Italian Menu: Antipasto, Primo, Secondo & More
Italians eat meals differently than Americans might be used to — restaurants offer several courses with much smaller servings. You can choose something from each course or select what looks best to you. Regardless of your method, an Italian menu will likely look like this:
Antipasto: Antipasto or antipasti are the appetizers. Here you’ll find salads, cheese plates and many local appetizers.
Primo: This menu section houses the pasta dishes or first courses. If you are going to Italy for pasta, remember this word, as Italian restaurants organize their dishes by course over category.
Secondo: The second-course section contains meats and seafood. These selections will include all types of meat, including regional dishes you can only find there.
Contorni: If you want a side, look to this section. You’ll find offerings similar to those in the antipasto section, like cheese platters, salads and more.
Dolci: After dinner, your waiter might give you an additional, smaller menu with a list of desserts. Enjoy options like cannoli, gelato and tiramisu.
Digestivo: Your dessert menu might also have a digestivo section with drinks that Italians use to help them digest. Here you’ll find espresso and liquors, including limoncello, grappa, amaro, cynar, amaretto and sambuca. They’ll often come in a shot glass, and the preferred drink will vary depending on the region.
Vino: Did you know that Italy has 20 different wine regions? Perhaps most famous is Tuscany, which is full of outstanding regional wine and many restaurants across the country will partner with local vineyards to bring you excellent house selections. And visits to other parts of the country, such as Sicily, the Veneto, Campania, Puglia, and Friuli-Venezia Giulia (among others)!
15 Traditional Italian Dishes and Drinks to Try
With Italy’s rich food culture, Italians eat everything from pasta to seafood to rich meat dishes. Each region has unique dishes for you to try, ensuring you always have something tasty to eat. The country has many famous foods, from prosciutto di parma and olive oil to lasagna and gelato. However, knowing what to look for on the menu can help you find the best Italian cuisine, especially if you are unfamiliar with the language.
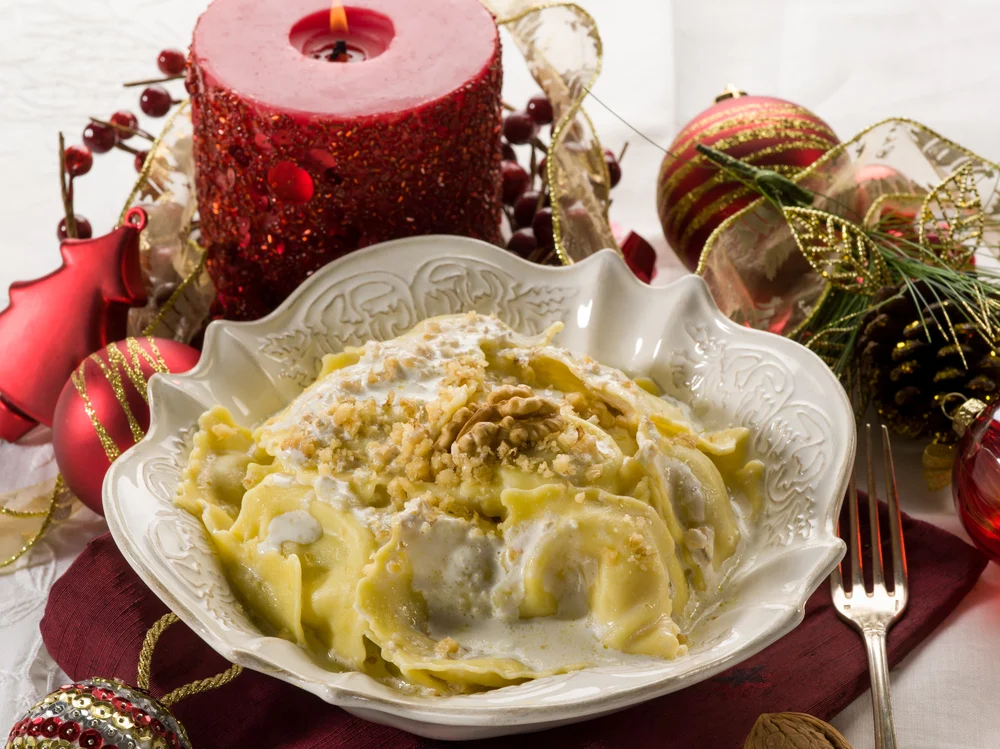
In Italy, Christmas meals feature rich pastas./Shutterstock
A trip to Italy wouldn’t be complete without trying some fresh, homemade pasta. Many restaurants make their pasta in-house and offer famous regional dishes that you simply have to try there. Trying regional pasta is a great way to connect with that area’s culture while having the best food there is to offer. Some regional pasta includes:
Tagliatelle: These long, thick pasta strips originated in the Emilia-Romagna region, host to the city of Bologna. You can find them with truffle or bolognese sauce. This dish is a must if you see it on a western Italian menu.
Tortellini: Also hailing from Bologna and Emilia-Romagna, tortellini is another classic you must try. You can find them stuffed with cheese or meat and in various dishes, from bolognese sauces to soups.
Orecchiette: Translating to “little ears,” this round pasta hails from the Puglia region in southern Italy. Puglia restaurants typically serve it with broccoli, so look for this on the menu for an authentic pasta dish.
Gnocchi: While you can find gnocchi all over Italy, it’s a must if you’re visiting Rome. The Romans make these heavenly soft potato dumplings fresh on Thursdays and serve them in various ways to fit your tastes.
Pici: A staple of the Tuscany region and Florence, pici is similar to spaghetti but thicker. You can find it served with meat sauces and dishes, where it can soak up and complement the dish’s rich flavors.
2. Authentic Gelato
Windstar President Chris Prelog is a huge advocate for Italy’s gelato
How is gelato different from ice cream? Food and Wine tells us this: “gelato has a lower milk fat content than ice cream, usually 4 to 9 percent, yielding a softer, denser texture and smaller ice crystals. That’s a result of the base, which typically includes less cream and more milk, as well as a slower churning process that introduces less air into the final product. The base generally does not include eggs, but it can. Gelaterias also keep their cases at a warmer temperature than most ice cream shops, which contributes to gelato’s silkier texture. Although there’s no legal standard for gelato in the U.S., the Italian government requires a milk fat content of at least 3 percent.”
Some signs of a homemade gelateria include:
Colors: Authentic gelato places will have natural flavor colors over bright, colorful batches. Pay attention to flavors like mint and pistachio, which are often dyed to appear more appetizing.
Containers: Gelaterias that ship gelato in or store it will use big open containers. The gelato will often sit up high for travelers to see through the glass. A homemade batch will sit in a closed metal container to keep it fresh and protected.
Finding a local gelateria can help you find some of Italy’s best food. If you want to eat like the Italians, try hazelnut or pistachio. Stracciatella is another classic Italian flavor with a vanilla base and small chocolate chips spread throughout.
3. Cappuccino and Espresso
In Italy, espresso and cappuccino are meant to be enjoyed at very distinct times of the day.
While many cultures celebrate their premium coffee, nothing beats Italian cappuccinos and espressos. You’ll seem more like a local in Italy by knowing when to order which.
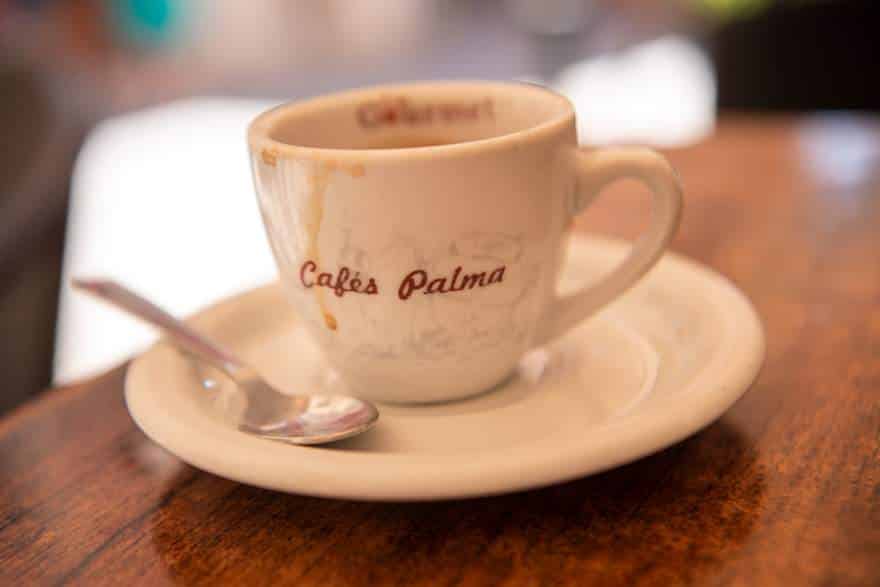
Cappuccino is a morning drink similar to Americans’ morning coffee. Italians brew them at the perfect temperature so that you can drink them immediately. On the other hand, espressos are a digestive drink that Italians have after dinner or in the evening. You’ll find them on many menus alongside desserts or other digestive drinks.
Favorites You’ll Find in Northern Italy:
4. Ossobuco (Milan)
For another meat option, consider ossobuco. This dish comes from Milan and the Lombardy region in the north of Italy. Ossobuco is a bone-in veal shank slow-cooked in a meat broth with vegetables and white wine, resulting in a rich, tender, juicy meal. Many restaurants serve it with polenta or risotto.
Because of how long it takes to cook ossobuco, you might only rarely find it on menus. Be sure to treat yourself to the experience if you come across it, especially in Lombardy.
5. Risotto (Northern Italy)
Traditionally thought of as a rice dish produced in northern Italy, the combination of superb recipes and top-notch crops of rice are being explored by chefs from Palermo to Turin.
6. Pesto alla Genovese (Liguria)
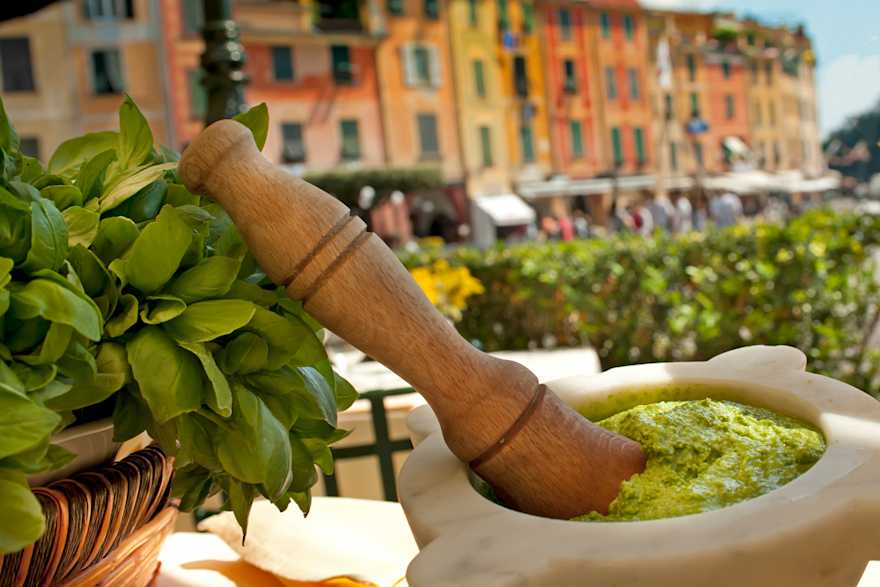
Pesto, typically made with fresh basil, is one of the most popular Italian pasta sauces./
Pesto, best known in the region of Liguria (home to Genoa and Portofino) is a favorite pasta sauce, using crushed fresh basil, garlic, pine nuts and Parmesan cheese. If you’re a purist, you use a mortar and pestle to carefully grind the ingredients so as not to bruise them.
Beyond pasta, pesto makes a great sandwich spread and a cocktail dip.
7. Polenta
Polenta is another historical peasant dish many restaurants continue to serve in Italy. While you can find it all over the country, it originated in northern parts of the country, including Milan, Turin and Venice. Polenta is a starch dish commonly made from finely ground corn that takes many forms, from mush to fried slices.
This Italian food is exclusively a side dish. You’ll commonly see it paired with rich meats with plenty of sauces. You’ll often find it during the colder months because of its popularity alongside warmer comfort food.
Favorites You’ll Find in Central Italy
8. Florentine Steak (Bistecca alla Fiorentina)
Florence is the home of many rich dishes and drinks, and Tuscany is a popular destination for visiting vineyards and tasting traditional dishes. Florentine steak is a thick t-bone cut fresh from cows raised in Tuscany. The Florentines favor a high cut with lots of muscle, giving the steak an excellent flavor. Pair it with a house red wine for an authentic Tuscan meal.
When ordering this steak, know that it’s only available very rare. Many restaurants prepare it by cooking it for a few minutes so the outside sears, leaving a soft, rare middle that melts in the mouth. While restaurants also often charge by the steak’s weight, its thickness makes it perfect for two people to share.
9. Ragù di Cinghiale — Wild Boar Ragù (Tuscany)
If you like meat sauces and lasagna but want to try something new, ragù di cinghiale is the way to go. This traditional Tuscan dish is easy to find in Florence and features a wild boar sauce. The animal is common in the region, ensuring a rich, fresh meal you can’t find anywhere else in Italy.
Because of its thickness, many restaurants in Florence pair the cinghiale sauce with pici or thicker flat pasta like pappardelle. The pasta and sauce can be heavenly when you find a place that offers house-made pasta. Order a house red wine to complete the experience.
10. Ribollita (Tuscan Bread Soup)
While many travelers go to Italy for pasta, the country has a wide variety of foods for you to enjoy while visiting. Ribollita is a Tuscan vegetable soup. It was historically a peasant meal, rich in local, in-season vegetables that the lower class could easily access. Today you can still find it full of recent harvests, making it common in the fall when Italian farmers are picking their crops.
Instead of meat, ribollita uses bread to thicken and flavor the soup. It’s savory and hearty, and many Italians choose it on chillier days to help them warm up.
When traveling in Tuscany and Florence, it’s common for restaurants to list ribollita as a first-course dish along with pasta courses.
11. Spaghetti alla Carbonara (Rome)
When in Rome, eat as the Romans do. The capital city is home to many famous Italian dishes, including carbonara. Typically served with spaghetti, carbonara is a sauce made from eggs, pecorino cheese, cured ham and black pepper. Many Roman restaurants serve it with fresh pasta as their house special.
If you want to find the best carbonara in Rome, ask the locals or go off the beaten path. Trastevere is a neighborhood in Rome famous for its restaurants and Italian cuisine, making it a great place to start if looking for a good carbonara. The brightly colored buildings and draping vines add ambiance to your meal when eating outside.
12. Truffles (Tartufi)
Truffles, a type of mushroom that grows in Tuscany, Umbria and Piedmont, are some of the best foods to eat in Italy. These regions often train dogs and pigs to sniff out truffles to use in traditional dishes.
Truffles have a unique smell that gives dishes a distinctive taste and draws avid food-lovers to them. You will often find them over pasta or in sauces, especially in the fall, when they are more common.
Favorites You’ll Find in Southern Italy & Sicily
13. Margherita Pizza (Naples)
If you find yourself in Naples, you must try traditional Margherita pizza. This Campania city considers itself the birthplace of the classic dish that became popular when Queen Margherita visited in 1889. This pizza has a simple tomato sauce topped with fresh mozzarella and basil leaves. Now Naples is famous for its various pizzas, including the Margherita.
When ordering pizza in Italy, be sure to translate any Italian ingredients beforehand. Pepperoni translates to peppers in Italian — expect to receive a pizza topped with green or red vegetables when ordering a pepperoni pizza.
14. Bottarga (Sicily)
Bottarga is a traditional Sicilian dish made from the roe of gray mullets, which Sicilians will salt, press and air dry for months to create a savory, smokey flavor.
Restaurants buy and serve their fish fresh for the best tastes you can find. You will often see bottarga shredded or sliced over pasta. Restaurants will often pair it with lemon juice or olive oil because of how the flavors mix.
15. Arancini and Supplì
While the thought of Italian food might conjure images of sipping wine at elegant outdoor restaurants each night, street food is popular and tasty in Italy. Arancini and supplì are two types of fried rice balls from different Italian regions. You can find these great to-go appetizers at market stalls, restaurants and bars.
Sicilian arancini have a distinct triangular shape, making them easy to hold and carry around. Most places will fill them with ragù sauce and cheese, though you might have the option to add vegetables like peas, mushrooms or eggplant.
Supplì are from Rome. They have an oblong pill shape and contain tomato sauce and mozzarella instead of ragù. The cheese usually melts, pulling apart when you split the supplì in the middle. Supplì are standard antipasto options in Roman pizzerias.
Frequently Asked Questions
What’s the difference between gelato and ice cream?
Gelato has less milk fat, less air churned in, and is served slightly warmer, giving it a denser, silkier texture than American ice cream.
Should I order a cappuccino or an espresso in Italy?
Cappuccino is a morning drink; espresso is what Italians order after a meal, in the evening, as a digestivo.
How is an Italian menu structured?
By course, not category — antipasto, primo, secondo, contorni, dolci, and digestivo, rather than starters/mains/dessert.
Read more about Italy
Whether it’s your first visit or you’re an expert, check out our recent blogs on crafting a magical Italian experience in the Mediterranean:
One traveler discovers why winter in Venice offers surprising perks.
In the village of Portofino, on the Italian Riviera, we share our favorite food and drink.
Emiko Davies is one of our favorite Italian culinary experts (she’s also considered top notch when it comes to Japanese cuisine); we love her blog on all things cuisine-related.
What is it like to cruise a classic Mediterranean voyage in winter? We loved it. Here’s our story.
Curious how small ships get you into ports the big lines can’t? Here’s our guide.
Original content owned & copyrighted by Green Global Travel.
Let’s say you’re in a new country, thirsty, and faced with a common traveler’s dilemma: Do you buy a plastic bottle of water, which is ultimately destined for a local landfill, or do you risk drinking the tap water and getting an upset stomach?
The allure of a factory-sealed bottle feels like a simple, safe solution to a complex problem.
But with each purchase, you risk contributing to plastic pollution and blemishing the pristine natural landscapes likely you’re traveling to see.
To help you navigate your water worries when you travel, this guide will empower you with the knowledge to make smart and sustainable choices.
When we’re talking about it being unsafe to drink tap water abroad, it’s not because the water is inherently “dirty.”
The issue is that the water in different regions of the world may contain very different microorganisms, and is often treated to different health standards.
Your body is accustomed to the water you drink at home, but it may not be equipped to handle these new bacteria, viruses, and parasites.
Even water that looks and tastes clean can carry invisible pathogens that cause a range of health problems, from mild cases of traveler’s diarrhea to more serious illnesses like E. coli and Giardiasis.
North America- Canada, United States Europe- Andorra, Austria, Belgium, Czech Republic, Denmark, Finland, France, Germany, Greece, Greenland, Iceland, Ireland, Italy, Liechtenstein, Luxembourg, Malta, Monaco, Netherlands, Norway, Poland, Portugal, San Marino, Slovenia, Spain, Sweden, Switzerland, United Kingdom, Vatican City Asia- Brunei, Hong Kong, Israel, Japan, Singapore, South Korea Oceania- Australia, New Zealand
While an increasing number of countries provide visitors with safe drinking water, travelers should exercise caution in many parts of the world, where water treatment standards differ from those to which their bodies are accustomed.
In large parts of Asia, Africa, and Central and South America, it is generally recommended to avoid drinking the tap water to prevent waterborne illnesses.
This is often due to aging infrastructure, less consistent treatment protocols, or potential contamination from agricultural runoff.
Note that this is not an exhaustive list, and conditions often vary within a given country from cities to rural areas. But as a general rule, you should plan on using a purification method or drinking factory-sealed bottled water in many destinations, including:
North America- Mexico Africa- Egypt, Morocco, Nigeria, Kenya Asia- China, India, Indonesia, Thailand, Vietnam, Cambodia Central America- Belize, Guatemala, Honduras, Nicaragua South America- Brazil, Colombia, Peru, Bolivia, Ecuador
But remember, this caution should also extend beyond drinking water. Travelers should avoid ice in drinks (which is likely made from tap water). You may also want to refuse salads and uncooked vegetables that may have been washed in tap water and use bottled water to brush your teeth.
When in doubt, we always opt for a reliable purification method or a factory-sealed bottle of water!
You don’t have to purchase an endless supply of single-use plastic bottles when you’re traveling to a destination where the tap water is questionable. In fact, there are several ways to treat or purify contaminated water effectively while on the go!
Boiling
Boiling is the most effective method for killing all types of pathogens. Simply bring water to a rolling boil for one minute (or 3 minutes at altitudes above 6,500 feet). The main drawback is that it requires a heat source and time and won’t remove sediment.
Water Filter
A good portable water filter is an excellent tool for removing bacteria and parasites. Look for an “absolute” pore size of 5 microns or smaller. Filters are convenient and don’t change the taste of the water, but they may not remove viruses. Verify the strength of your filter against common contaminants in the area.
Ultraviolet (UV) Light
UV purifiers are high-tech devices that use ultraviolet light to destroy the DNA of bacteria, viruses and other pathogens, rendering them harmless. They are incredibly quick, often treating a liter of water in 48 to 90 seconds, with no chemicals or change in taste. They are easy to use but require batteries and are only effective in clear water, as sediment can block UV rays.
Disinfection
Chemical disinfection, such as iodine or chlorine tablets, are an inexpensive and lightweight way to purify water. They are effective against most pathogens, but they can leave an unpleasant taste and may not kill all parasites.
Purifying your own water has an impact that extends far beyond your own health. The massive environmental problem caused by single-use plastics is something everyone can work to reduce.
On average, only 9% of the world’s plastic waste is properly recycled, while 22% is improperly handled.
Given that the average U.S. citizen produces roughly 290 pounds of plastic waste each year, these staggering numbers represent an urgent need to do better by the planet.
Starting as fossil fuels and releasing carbon emissions for production, the plastic bottles you purchase end their short lives in landfills, where they can take centuries to decompose, or in our oceans, where they harm marine life.
When you use a reusable bottle and a purifier, you consciously reduce your carbon footprint.
With a little preparation, you can protect your health without harming the planet.
By understanding the risks, knowing where the tap water is safe to drink, and equipping yourself with the right tools, you can travel with confidence.
Make a “water plan” part of your pre-trip checklist, right alongside booking flights and packing your bags.
Before your next trip, invest in a reusable water bottle and a purification method that suits your travel style. It’s a small step that can make a big difference for your health and the future of the planet! –by Alex S. Morrison
Before Larry Elmore became one of the artists behind Dungeons & Dragons’ popular imagery, he was drawing tanks and rifles for the U.S. Army.
Elmore has been drawing for as long as he can remember, but growing up in a family with limited means meant his family had to ration paper, he said in a conversation with Fort Knox Public Affairs Office reporter Savannah Baird.
When Elmore was drafted into the Army after graduating with a fine arts degree from Western Kentucky University, the service gave him the resources to hone his craft, he told Baird.
“Once I got assigned, the Army saw my portfolio and realized I could draw just about anything from memory, so they put me on illustration work,” Elmore said in the release.
The Army changed the look of its field manuals in the 1970s to include more illustrations, and Elmore’s talents were put to use. After studying objects, Elmore could retain their images and draw them from memory, including tanks and rifles, he told Baird.
“It was a God-given gift and I used it,” he said.
Elmore went to basic training and was stationed at Fort Knox. During his time there, he developed skills he had not learned in college.
“Illustrations in the ’70s were just line work, pure ink — white and black, no grays — and they didn’t teach you that in college. I developed those skills at Fort Knox,” he said in the release.
After completing his two-year obligation, Elmore decided to stay on as a contractor, Baird reported. Around that time, a new employee joined the staff and introduced the team to Dungeons & Dragons, changing Elmore’s life.
Despite his initial hesitation, he began playing the game with his coworkers and quickly became hooked, calling it “the king of all games.”
Dungeons & Dragons was relatively new at the time, and its art was elementary, Elmore told Baird. He recalled that a fellow artist said he was going to submit his artwork to Tactical Studies Rules, or TSR, the company behind Dungeons & Dragons, because “our art is much better than this.”
Elmore then decided to submit his own portfolio to TSR, which included drawings he had produced for the Army. Soon after, TSR offered to double his salary, hire his wife and move them to Wisconsin, the release stated.
Elmore said he immediately shook the company representative’s hand and told him, “you just bought yourself an artist.”
He went on to create one of the most recognizable images in the game’s history: the cover art for the famous “Red Box” set, which featured a warrior in combat with a red dragon.
After six years at TSR, Elmore decided to move back to Central Kentucky and pursue freelance work for another 40 years, according to the Army’s release.
He recognizes the impact the Army had on his career as an artist.
“I was very lucky,” he said in the release. “Sometimes, I think to be successful you have to be good, but you got to have some of those weird breaks in life — and I got two or three.”
If you’re leaving Google Photos and want the closest thing to a straight replacement, it’s Ente. It’s end-to-end encrypted, open source, and it has a step-by-step import path for Google Takeout archives. If what you’re moving is a real photo archive rather than a camera roll, no single app will do the job. You want…
I’ve been shooting travel photography professionally since 2010, and in that time I’ve bought into the tablet-as-editing-machine idea twice. Both times I ended up back at my desktop. Things have moved on a lot since then, and the tablets in this guide are far better machines than either of mine were, but my position hasn’t…
Last Updated on August 10, 2026 by Sarah Wilson Need to Know Before You Go 📍 Best for: Wildlife, scenic drives, gentle walks and a relaxing island escape. How long to stay: I recommend spending four nights on Arran. I only had three nights because I missed my original ferry, and I really wished I’d […]
Almost every category of VA disability claim grew last year. Endocrine conditions didn’t. New endocrine claims (the body system that includes diabetes and thyroid conditions) fell 18.6% year-over-year, the steepest drop of any of the 13 body systems tracked in the annualVBA Compensation Report.
That’s worth pausing on. Total VA disability claims grew 11.6% system-wide in the same period. Digestive claims jumped 21.8%. Musculoskeletal, mental health, dental — all are up. Endocrine went the other direction, and diabetes is the largest condition inside that category.
In this article I’ll break down what the data shows, what it doesn’t explain, and what it means if you’re a veteran with diabetes, or a toxic-exposure condition that could be connected to it, weighing whether to file.
Table of Contents
Summary of Key Points
New endocrine-category VA claims fell 18.6% year-over-year in FY2025 — the steepest decline of any body system tracked.
That decline runs against the grain of the broader system, which grew 11.6% in total service-connected disabilities over the same period.
Diabetes mellitus is the largest condition inside the endocrine category, with 445,840 veterans currently receiving compensation.
Hypothyroidism, the second-largest endocrine condition, affects 105,601 veterans and is often connected to radiation exposure or certain medications.
The VBA data documents the decline. It doesn’t ID a cause — this article doesn’t speculate on VA scrutiny, policy changes, or filing behavior (beyond what the data supports).
New endocrine-category VA disability claims — the category that includes diabetes — fell 18.6% in FY2025, the steepest decline of any body system in the VBA data, even as total VA disability claims system-wide grew 11.6%. Diabetes is the largest condition in that category, with 445,840 veterans currently receiving compensation for it. The data shows this decline clearly; it doesn’t explain why it’s happening.
The latest VBA Compensation Report tracks new service-connected disabilities granted to new compensation recipients across 13 body systems, comparing FY2024 to FY2025. Twelve of those systems were flat or growing. Endocrine was the exception:
Body System
FY2024 New Claims
FY2025 New Claims
YoY Change
Digestive
97,542
118,805
+21.8%
Musculoskeletal
1,176,817
1,287,268
+9.4%
Mental Health
163,644
178,379
+9.0%
Dental/Oral
19,983
21,720
+8.7%
Neurological
291,292
308,494
+5.9%
Respiratory
159,192
159,648
+0.3%
Cardiovascular
87,505
77,178
-11.8%
Endocrine
22,943
18,676
-18.6%
Source: VBA Compensation Report, five-year new-recipient trend tables. Endocrine’s -18.6% is the largest single-category decline in the dataset — steeper than cardiovascular (-11.8%), the next-largest decline.
Diabetes is the Largest Condition in a Shrinking Category
The endocrine category covers a range of conditions, but diabetes mellitus dominates it by sheer population. As of FY2025, 445,840 veterans are currently receiving VA disability compensation for diabetes — by far the largest single condition inside the endocrine body system.
The VBA data doesn’t break diabetes out as its own line in the new-claims trend table — the -18.6% figure covers the entire endocrine category, not diabetes alone. But given how much of the category’s total population diabetes represents, a category-wide decline of this size is difficult to read as anything other than a signal that new diabetes claims specifically slowed in FY2025.
Hypothyroidism: The Category’s Other Major Condition
Hypothyroidism is the second-largest condition inside the endocrine category, affecting 105,601 veterans. It’s frequently connected to radiation exposure or as a side effect of medications used to treat other service-connected conditions — making it one of the more commonly overlooked secondary conditions in this category.
Diabetes mellitus is rated under 38 CFR § 4.119, Diagnostic Code 7913, on a scale that tracks how much the condition restricts your daily life and treatment regimen — not just whether you have a diagnosis:
10%: Manageable by restricted diet alone.
20%: Requires insulin or an oral hypoglycemic agent, plus a restricted diet.
40%: Requires insulin, restricted diet, and regulation of activities.
60%: Adds episodes of ketoacidosis or hypoglycemic reactions requiring at least one or two hospitalizations per year, or twice-monthly visits to a diabetic care provider, plus complications that wouldn’t independently qualify for a separate rating.
100%: More frequent ketoacidosis or hypoglycemic episodes, progressive loss of weight and strength, or complications that would render the veteran unable to maintain substantially gainful employment.
Complications of diabetes — including diabetic neuropathy, retinopathy, and kidney disease — are generally rated separately from the diabetes rating itself, which is one reason a thorough diabetes claim often ends up touching more than one body system.
It’s tempting to reach for an explanation here, and there isn’t a shortage of plausible ones — tighter VA review of diabetes claims, changes in how toxic-exposure diabetes claims are evaluated, or simply fewer new claims being filed in this category for reasons unrelated to the VA at all. The VBA data doesn’t establish any of these. It shows the trend; it doesn’t explain it.
What can be said with confidence: the decline is real, it’s the steepest of any body system in 2025, and it’s happening in a category where the largest single condition — diabetes — has a well-established connection to Agent Orange and other toxic exposures for many veterans. Those two facts sitting next to each other are worth a veteran’s attention even without a confirmed cause.
Diabetes and Presumptive Toxic Exposure
Type 2 diabetes mellitus has been a presumptive condition for veterans with qualifying Agent Orange exposure for years — meaning eligible veterans don’t have to individually prove their diabetes was caused by that exposure, only that they meet the exposure and service criteria. That presumptive status hasn’t changed.
What the data raises is a narrower question: even with a presumptive pathway available, new endocrine claims fell instead of rising alongside the rest of the toxic-exposure-driven growth the VA has seen since the PACT Act.
That’s worth sitting with rather than explaining away. A presumptive condition is still a claim that has to be filed, diagnosed, and documented — presumptive status removes the burden of proving causation, not the burden of proving you have the condition and that it’s currently rated at the correct severity.
What This Means for Your VA Claim
If you have diabetes and you believe it’s connected to your service — whether through Agent Orange exposure, another toxic exposure, or a documented in-service event — this data is not a reason to expect an easier or harder claim than before. It’s a reason to make sure your claim is built carefully rather than assumed to be a routine presumptive win.
Confirm your diagnosis is current and clearly documented in your medical records.
If you’re filing under a presumptive exposure category, make sure your service history and exposure evidence are documented as thoroughly as the diagnosis itself.
If diabetes developed or worsened after a service-connected condition — including medication side effects from treating another condition — ask your provider whether a secondary connection applies.
Every major body system in the FY2025 VBA data grew except one. Endocrine claims — led by diabetes, the largest condition in that category — fell 18.6% while the rest of the system grew 11.6%. The data doesn’t tell us why. It does tell us this is the year’s clearest outlier, in a category tied closely to toxic-exposure presumptives that affect a large and growing share of the veteran population. That combination is worth knowing about, whether or not it changes your next step.
YOU SERVED. YOU DESERVE.
You served. You earned the right to file. You earned the right to be heard. And you earned the right to pursue every VA benefit you legally qualify for.
So here is the real question:
Do you have the VA rating you were given, or the VA rating you truly deserve?
Want Expert-Level VA Claim Help? WE GOT YOUR SIX!
Work directly with a VA Claims Insider Coach who can help lead you to VA claim victory.
50,000+ disabled veterans served in our membership programs since 2016.
33% average rating increase for veterans who complete our Elite program.
The VBA data shows new claims in the broader endocrine category — which diabetes dominates by population — fell 18.6% year-over-year in FY2025. The data does not break out diabetes as a separate line item, so this figure reflects the endocrine category as a whole.
Why did endocrine claims fall while every other category rose?
The VBA data does not explain the cause. It confirms the trend — endocrine was the only body system with a double-digit decline in new claims — but does not attribute it to any specific policy, review process, or filing behavior.
How many veterans currently receive VA compensation for diabetes?
445,840 veterans were receiving VA disability compensation for diabetes mellitus as of the 2025 data, making it the largest condition in the endocrine category.
Is diabetes connected to Agent Orange or other toxic exposures?
Type 2 diabetes is a longstanding presumptive condition for veterans with qualifying Agent Orange exposure. This article does not assert that toxic exposure caused the 2025 decline — that connection isn’t established in the VBA data — but it’s relevant context for veterans in that population weighing whether to file.
What is hypothyroidism, and is it connected to VA disability claims?
Hypothyroidism is a thyroid condition affecting 105,601 veterans currently receiving VA compensation. It’s often linked to radiation exposure or as a secondary effect of medications used to treat other service-connected conditions.
Does a declining claims category mean claims are harder to win?
Not necessarily, and the VBA data doesn’t measure approval or denial rates at all. The decline reflects the number of new claims filed and granted, not the odds of any individual claim succeeding.
Content Reviewed By
Quality Assurance Team
The Quality Assurance (QA) team at VA Claims Insider has extensive experience researching, fact-checking, and ensuring accuracy in all produced content. The QA team consists of individuals with specialized knowledge in the VA disability claims adjudication processes, laws and regulations, and they understand the needs of our target audience. Any changes or suggestions the QA team makes are thoroughly reviewed and incorporated into the content by our writers and creators.
About the Author
Brian Reese
Brian Reese
Brian Reese is a world-renowned VA disability benefits expert and the #1 bestselling author of VA Claim Secrets and You Deserve It. Motivated by his own frustration with the VA claim process, Brian founded VA Claims Insider to help disabled veterans secure their VA disability compensation faster, regardless of their past struggles with the VA. Since 2013, he has positively impacted the lives of over 10 million military, veterans, and their families.
A former active-duty Air Force officer, Brian has extensive experience leading diverse teams in challenging international environments, including a combat tour in Afghanistan in 2011 supporting Operation ENDURING FREEDOM.
Brian is a Distinguished Graduate of Management from the United States Air Force Academy and earned his MBA from Oklahoma State University’s Spears School of Business, where he was a National Honor Scholar, ranking in the top 1% of his class.
Traveling with friends is an excellent option for any vacation. You can reconnect with your friends, experience new cultures and make lasting memories. The experience can relieve stress and enhance your creativity, making it a reinvigorating opportunity for everyone in your travel group.
The hardest part is usually agreeing on where to go. What if one friend wants beaches, another wants a city, and a third wants culture and cuisine? A cruise solves that problem before it starts. With multiple destinations built into a single itinerary, everyone in the group gets their version of the perfect trip, without the group chat debate over which single place makes the cut.
“At the end of the day you’re traveling to experience a new culture, a new country, and getting out of your comfort zone,” says Zulay Labra, who’s currently planning a Tahitian cruise on Star Breeze with friends she met on another Windstar voyage. “With friends, though, you’re traveling in a comfortable way. And taking a cruise comes without the anxiety of planning everything independently.”
We’ve picked a selection of cruise regions that really do offer something for everyone to enjoy, whether it’s culinary, active exploration, big city museums or local culture. Or all of them! And at the end of the day, remember this: It’s perfectly okay to go in different directions during the day, and then reconnect for cocktails and dinner to share experiences.
Alaska and British Columbia
Alaska is an unforgettable destination for your friends with diverse . The state contains a wide range of natural landmarks, from glaciers and shorelines to breathtaking mountains and crowded cities. Alaska is famous for its natural beauty and wildlife, making it an excellent option for friends who love the outdoors. Possibilities include bear trekking, kayaking, hiking, and flightseeing. This region is also well known for its fantastic microbrews; in Ketchikan, in particular, both Baleen Brewing Co. and Bawden Street are worth visiting.
Tokyo on a mostly around-Japan voyage
Another example of the best places to go on a trip with friends is Tokyo, Japan. Asia can be a multi-faceted trip for adventurers and it’s nice to have pals along to share discoveries. Tokyo is a fast-paced and beautiful city, known for its technology, historical sites and delicious food. It has a unique blend of modernity and tradition, with new skyscrapers resting next to ancient temples.
The busy streets of Tokyo have much to offer for travelers. From endless shopping opportunities to interactive museums, you and your friends can find activities that match your interests. You could visit the Sensoji Temple, the oldest religious site in Tokyo, or explore the Tokyo Skytree. Or, you could explore Akihabara, a neighborhood dedicated to manga and electronics. No matter how you spend your time, be sure to taste Tokyo’s extraordinary food, from sushi to tempura.
Because of Japanese cabotage restrictions that require around-Japan itineraries to call in at least one foreign port, most Windstar cruises visit the fantastic “Los Angeles of Korea” city of Busan.
Circumnavigating Iceland
Cafe hopping is a summer pastime in Reykjavik./Carolyn Spencer Brown
Iceland is a one-of-a-kind travel experience in which craggy natural scenery and cosmopolitan towns and cities. The country’s dramatic landscape features volcanoes, mountains, glaciers, hot springs and more. Its capital city, Reykjavik offers art and cultural experiences like the National Museum of Iceland and the National Gallery of Iceland. Akureyri, its second largest city, is home to the North Iceland Symphony Orchestra.
And yet, what both also offer to diverse groups of travelers is plenty of expedition-type exploring.
What may surprise you about Iceland is how delightful are the ports that you may never have heard of. In Grundarfjordur Snæfellsjokull National Park is magically full of regal glaciers, lava fields, waterfalls, caves, calderas, and basalt cliffs. In Seydisfjordur, spend a few hours chasing waterfalls and then attend Windstar’s exclusive Destination Discovery Event, Sagas & Songs at the Blue Church. Nested between mountains that are snowcapped even in summer and the sea, Isafjordur is a charming small town, perfect for just strolling and it’s also home to Dokkan brugghús, one of Iceland’s best breweries.
St. Maarten/St. Martin and the Eastern Caribbean
On the French island of St. Barts, head over the mountains to the sleek village of St. Jean, where beaching it competes with shopping in chic boutiques and lavish meals./Adobe
Hankering for the Caribbean? St. Maarten, a departure port for many Windstar cruises, is part of a two-nation island. The Dutch St. Maarten is the spot for nightlife, casinos and an awesome zipline experience. The French St. Martin is better known for its culinary fusion that blends Creole and French techniques, its duty free shopping, and the lively bustle of Marigot, a market town. Both have plenty of beaches, all with different personalities and in both cases water-based sports, from kayaking to parasailing, are plentiful. And you can easily travel between the two as there’s no border control.
Choose an itinerary that spends time in the British Virgin Islands and St. Barts for the perfect balance of sophisticated shopping and dining and just-chillin’-out.
Costa Rica and the Panama Canal
Beach dancing in Costa Rica/
Another tropical destination for your group of friends is Costa Rica. This gorgeous location has a diverse range of nature, from rainforests to volcanoes. If you have any animal lovers in your group, Costa Rica is full of exotic wildlife you can view up close. Watch a rare bird soar through the sky or spot a shark in the blue water.
You can rest on the beautiful beaches or sample the tasty local food offerings. Costa Rica also offers various wellness activities, like immersive body wraps or hydrotherapy. It’s an ideal place for refreshing and relaxing from work or other life stressors. And once you learn new relaxation techniques, you can integrate them into your lifestyle at home.
Athens and the Greek Isles
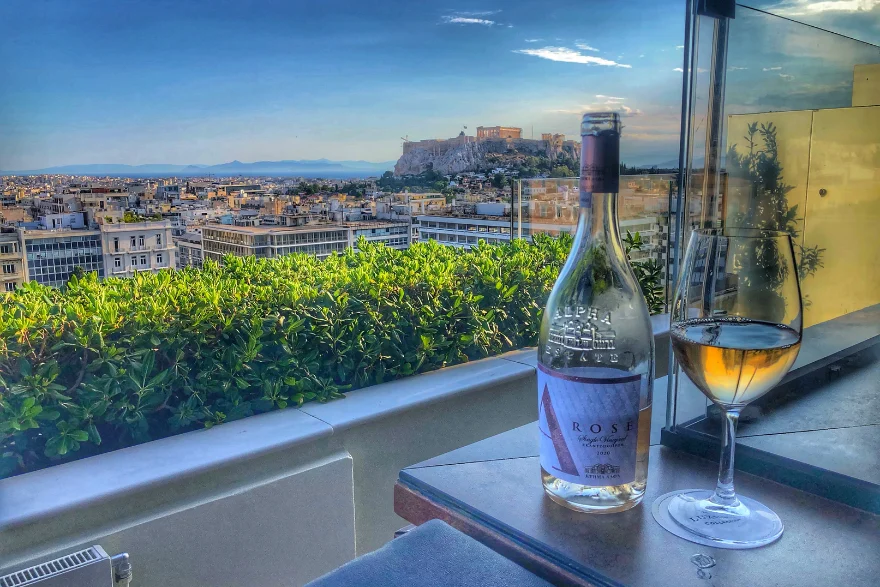
A pure and blissful moment in Athens: sharing a bottle of Greek rose with friends, and a view of the Acropolis — and the Mediterranean, just beyond./Carolyn Spencer Brown
Athens is a popular home port for around Greece voyages. Itineraries typically depart from Athens, so plan a pre- or post-cruise stay there before heading out to remote islands, picturesque villages and fabulous beaches. In Athens, you can immerse yourself in Greek culture and the elegant landscapes. Athens is one of the world’s oldest cities, displaying centuries of history and culture. Greece is an unforgettable vacation spot, with breathtaking landscapes and historical monuments. You and your companions can visit everything from historical temples to theatres, either on foot or on a bike. Athens has endless opportunities for dining, exploration and leisure, allowing your travel group to create an itinerary that matches your needs.
Italy’s Venice and the Adriatic Sea — in winter!
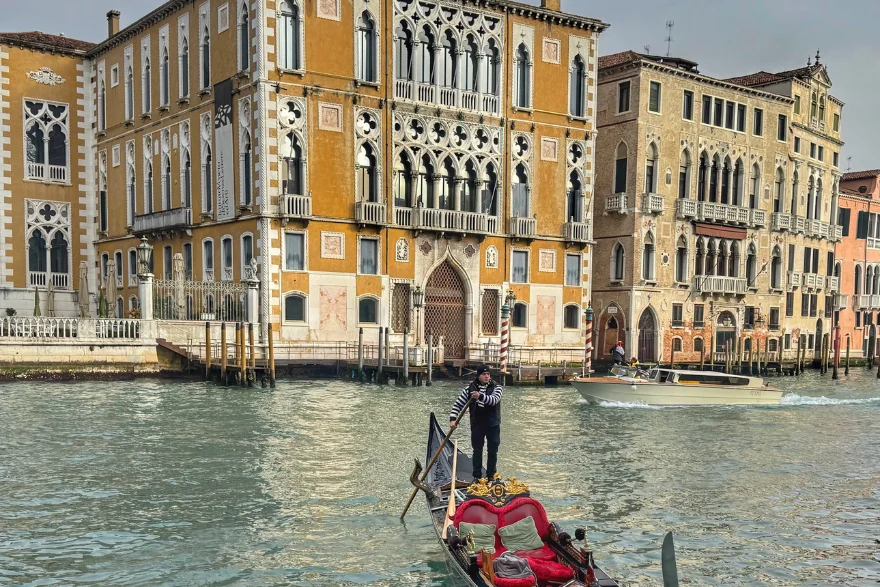
An empty gondola! One of the many appeals of a winter season cruise from Venice is there are plenty of opportunities./Carolyn Spencer Brown
There’s a lot to love about an off-season (winter) Mediterranean voyage that travels between Venice and Rome by way of the Adriatic Sea. An Adriatic cruise that departs from (or arrives at) Venice is a classic destination for world travelers. Plan to arrange for a few days in La Serenissima before heading out to Croatia, Kotor, and Italy’s Sicily and Sorrento. Advantages to an off-season voyage? Attractions and museums are open — and uncrowded. Dining reservations are easier to secure. And discounts abound from pre- or post-cruise hotels to the voyages themselves.
In Europe, visit London, Amsterdam and Bruges on Quick Getaways
Windstar’s small yachts allow travelers to get up close and personal with cities like London and rivers like the Thames./Windstar
New for Windstar is a series of short European sailings that are a perfect way for busy pals to commit to a trip together. Quick Getaways: Sweet Blessings, is a four night sailing that sails down London’s Thames and visits the Belgium cities of Bruges and Antwerp before returning to London.
Other options include the four night London-based St. Malo getaway to visit Mont St. Michel, truly a bucket list destination, and Seaside Charms and Dutch Waterways, a three night trip from London to Amsterdam by way of Bruges and Harlingen. Want an onboard overnight on the Thames? The five night Timeless Maritime Powerhouses sails from Amsterdam via Antwerp and Normandy’s Honfleur, before docking in central London.
French Polynesia’s Tahiti, Bora Bora and Huahine
In the Marquesas, a couple of friends get immersed in nature via bikes./
Tahiti is another one of the best places for travel, characterized by clear waters, thick forests, luxurious resorts and French cuisine. This remarkable island provides the ultimate relaxation experience, surrounded by warm sunshine and fresh fruit. It’s one of the best beach vacations for large groups.
One of the top ways to experience Tahiti is by cruise. You and your friends can ride through crystal-clear water to reach this paradise-like island. Once you’re there, explore the nearby waterfalls and gardens. Or, spend all day on the beach, with its pure white sands and clear blue waters.